
Billing Widget
Last updated - 31 December, 2025
The Billing widget allows you to visualize cloud billing data directly on your LogicMonitor dashboard.
When you create a new Billing widget, you can specify the scope of your data, group and filter results, and customize charts to create visualizations of your billing data.
Billing Widget Visualizations and Features
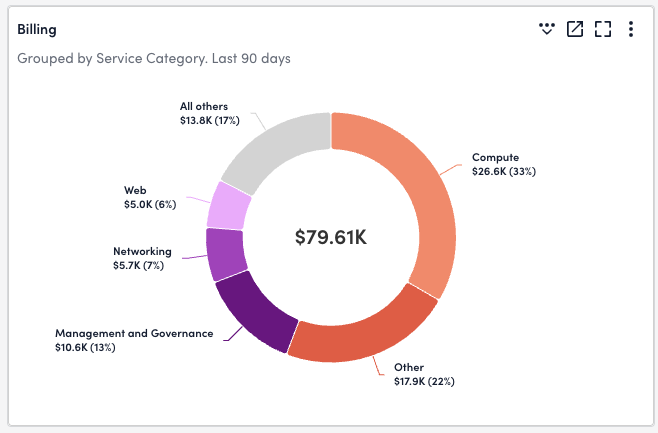
The Billing widget provides the following visualization types for cloud billing data:
- Area Graph—Displays the total dollar amount of all active billing, broken down by Drill Down dimensions over time.
- Big Number with Trend—Displays a single value representing the cost for the time range selected in the Time Frames for Comparison dropdown, compared to the cost for the same time range in the previous period.
- Bar Chart—Displays a bar chart filtered using Filter By and separated by Drill down dimensions.
- Bar Chart – Stacked—Displays a bar chart with items stacked vertically, filtered using Filter By and separated by Drill down dimensions.
- Column Chart—Displays a column chart filtered using Filter By and separated by Drill down dimensions.
- Column Chart – Stacked—Displays a column chart with items stacked vertically, filtered using Filter By and separated by Drill down dimensions.
- Donut Chart—Displays a round chart filtered using Filter By and separated by Drill down dimensions.
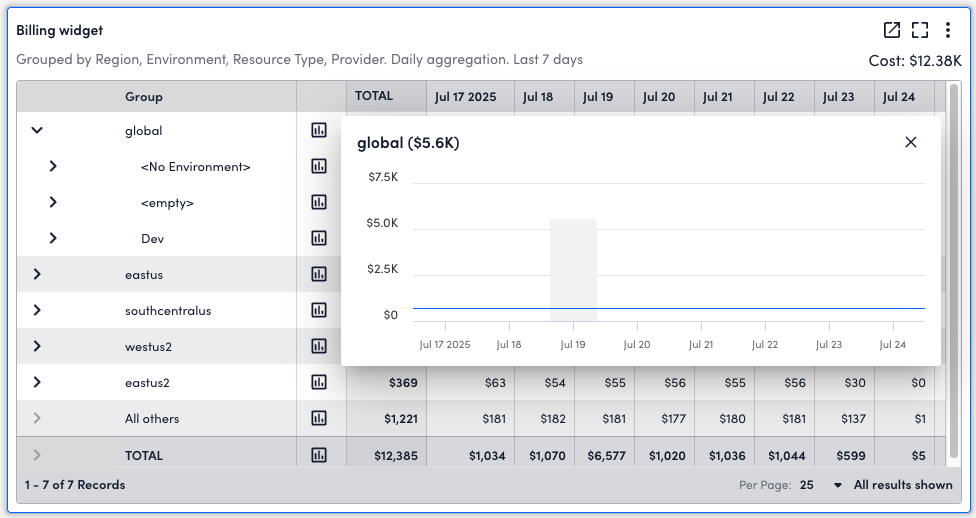
- Grouped Table—Displays a table with all billing data by region.
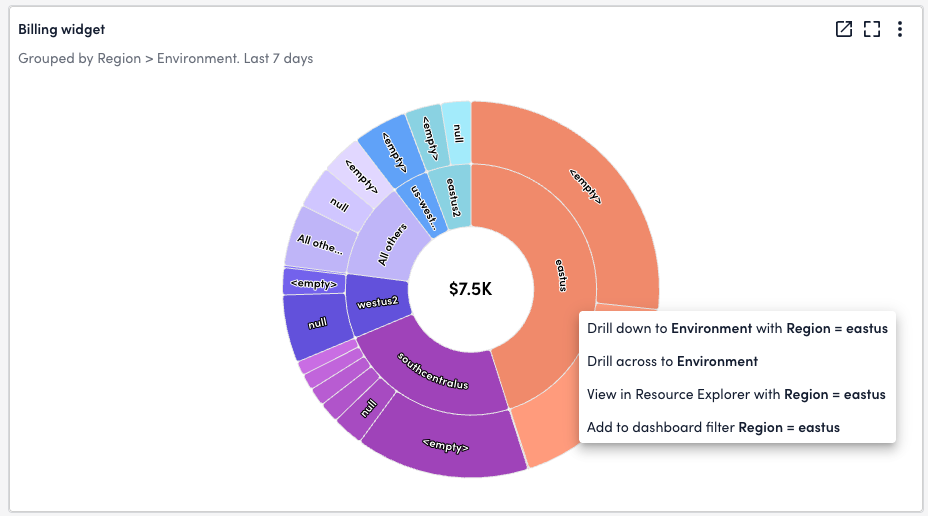
- Sunburst Chart—Displays a round chart with multiple rings, organized by Drill down dimensions.
- Top Movers—Displays the total cost of cloud resources over two specified time periods.
Drill Down Dimensions for Configured Billing Widgets
The Drill Down Dimensions feature allows you to customize the granularity of your Billing widget views by focusing on more specific dimensions within the filters you set for your widget. By adding drill down dimensions, you can select specific areas in your widget view to see billing data focused on those dimensions within the filters applied above the dimension you select.
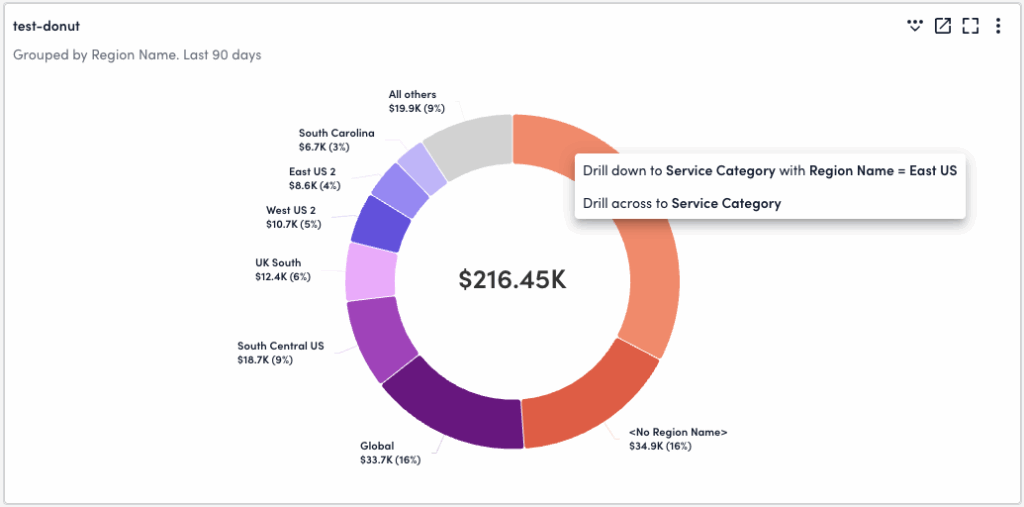
For example, you can configure a Donut Chart of billing data with drill down dimensions for Region, Service Category, and Environment. If you select the “East US” region in the top level of the widget chart, a menu displays “Drill down to Service Cagetory with Region Name = East US” and “Drill Across to Service Category.“
If you select the “drill down” option, the chart refreshes to display all of the service categories within the region previously selected. If you select the “drill across” option, the chart refreshes to display all service categories across all regions that display in the original chart view. You can continue to select chart segments on each view to drill down or across to Environment.
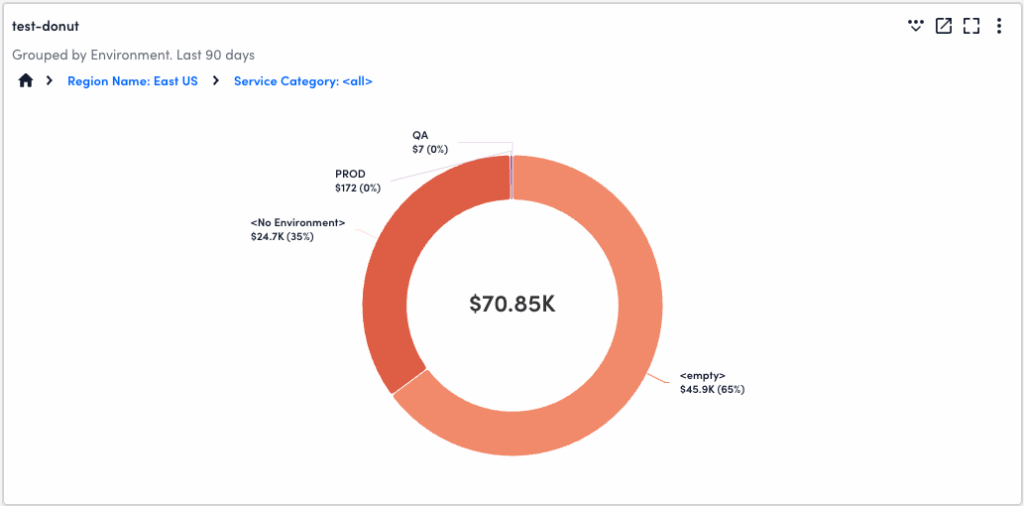
You can continue to drill down or across as many dimensions as you add when configuring your widget. When selecting an option from the drill down menu, dimensions display in the order in which you set them when configuring the widget. To navigate to any previous dimension, select the dimension from the hierarchy list above the widget chart.
Note: If your widget displays Total cost values, this value displays the total only for the currently selected dimensions. To see the full total cost of all dimensions in a widget, toggle “Group remaining (if any) as “All others” on the Manage menu.
Grouped Table Interactions
Within a Grouped Table visualization, you can expand each list item by selecting ![]() Expand next to any row in the table. The table will expand to show results from the next drill down dimension, nested within the primary dimension shown in the list.
Expand next to any row in the table. The table will expand to show results from the next drill down dimension, nested within the primary dimension shown in the list.
Select  View Graph Info beside any dimension in the table to view a graph tracking costs over time for the selected dimension.
Apply Dimensions to Dashboard Filters and Resource Explorer
You can use the Drill Down menu to apply dimensions to dashboard-level filters, or openResource Explorer with the current alias and value applied. When viewing a Billing widget, select a segment of the visualization just as you would to drill down or across.
Note:
- “Alias” refers to certain dimensions compatible with dashboard-level filters and Resource Explorer. For more information, see Compatible Dashboard-level Filters in this document.
- If the dimension you select is not compatible with Resource Explorer, you cannot select View in Resource Explorer from the menu.
- If the selected dimension is generated using “Group remaining (if any) as ‘All Others,’ dimensions will not populate.
The following options are available when you select a dimension:
- Add to Dashboard Filter (Alias)=(Value) – Apply the selected dimension to the universal Dashboards filter menu. This updates all existing widgets with the current widget configuration and selected dimension and value pair. This option will not apply if the selected dimension is applied using “Group remaining (if any) as ‘All Others’.”
- View in Resource Explorer with (Dimension)=(Value) – Resource Explorer in a new tab with the filter dimensions automatically applied to the resource filter menu.
Requirements for Configuring a Billing Widget
To configure the Billing widget you need the following:
- Access to the Cost Optimization feature
- Configure Billing visualizations on the Cost Optimization – Billing page
For more information, see Cost Optimization – Billing.
Configuring a Billing Widget
- In LogicMonitor, navigate to Dashboards, select a current Dashboard, or create a new one. For more information, see Dashboard Creation. Add a Billing widget. For more information, see Widget Creation.
- In the Name field, add a name to identify the new widget. Add a Description if necessary. For more information, see Configuring Standard Widget Settings.
- From Visualization Type, do one of the following:
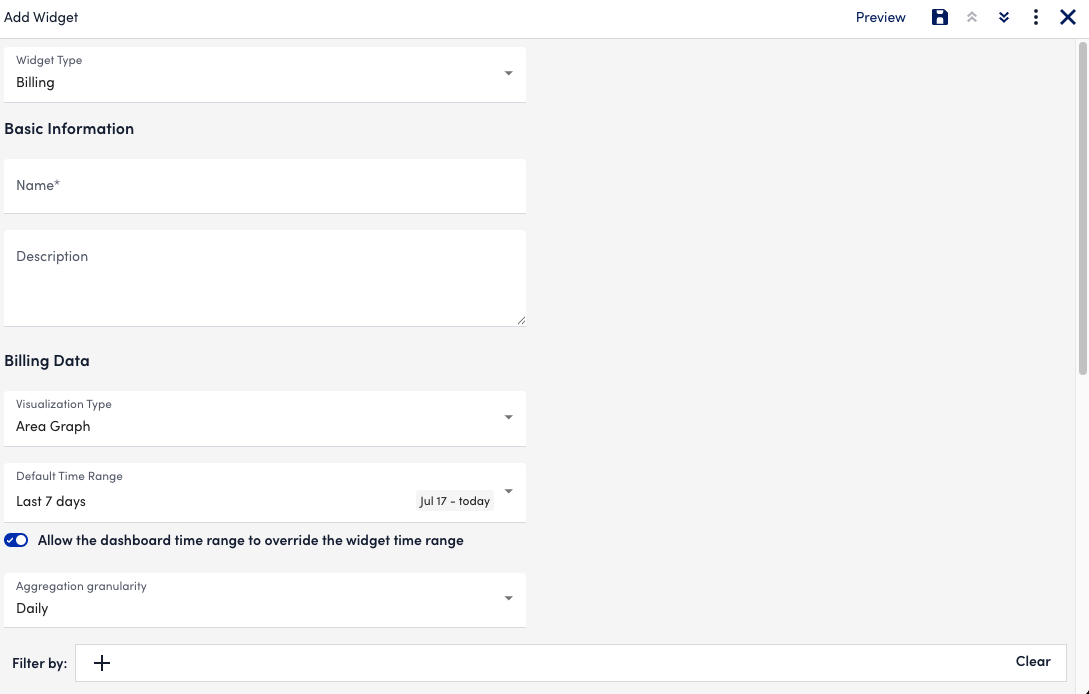
- To configure an Area Graph visualization, select “Area Graph” and do the following:
- In Default Time Range, select a time period to display billing data.
- (Optional) Toggle Allow the dashboard time range to override the widget time range on or off. When on, this prevents the dashboard level time range from overriding the time range set in Default Time Range on the widget.
- In Aggregation granularity, choose a time frame by which to display billing data.
- To configure an Big Number with Trend visualization, select “Big Number with Trend” and then select a timeframe to display the billing data from Times Frames for Comparison.
- To configure a Bar Chart, Bar Chart-Stacked, Column Chart, or Column Chart – Stacked visualization, select “Bar Chart”, “Bar Chart – Stacked”, “Column Chart”, or “Column Chart – Stacked” and do the following:
- In Default Time Range, select a time period to display billing data.
- (Optional) Toggle Allow the dashboard time range to override the widget time range on or off. When on, this prevents the dashboard level time range from overriding the time range set in Default Time Range on the widget.
- In the Aggregate by settings, choose how you want to aggregate data by doing the following:
- To choose a time frame by which to display billing data, select Time., and then choose a time from Aggregation granularity.
- To select a dimension by which to organize billing data, select Dimension., and then choose a dimension from Aggregation granularity.
- To configure a Donut Chart, Grouped Table, or Sunburst visualization select “Donut Chart,” “Grouped Table,” or “Sunburst” and do the following:
- In Default Time Range, select a time period to display billing data.
- (Optional) Toggle Allow the dashboard time range to override the widget time range on or off. When on, this prevents the dashboard level time range from overriding the time range set in Default Time Range on the widget.
- To configure a Top Movers visualization select “Top Movers” and do the following:
- In Dimension, select an alias or dimension by which to filter results.
- In Time Frames for Comparison, select a time frame within which to track changes in costs.
- In Default Sort-by, select whether to sort results by “Amount change” or “Percentage change.”
- In Types of Top Movers to Display, choose to display “Both increasing and decreasing”, “Only increasing”, or “Only decreasing” results.
- In Number of Top Movers to Display, enter how many line items you want to display in the visualization.
- (Optional)Toggle the Ignore any amount change less than specified value switch and enter a threshold value.
- (Optional) Toggle the Display filter selections on widget switch to display which filters apply to the table.
- To configure an Area Graph visualization, select “Area Graph” and do the following:
- In the Filter by field, do the following to filter billing data:
- Select Add.
- Select or search for a filter dimension from the menu.
- Select or search for a property within the selected filter dimension.
- In the Drill down dimensions field, do the following to further aggregate billing data:
- Select
 Add.
Add. - Select or search for a drill down dimension from the menu.
- Select
- In Results to display, enter a value to customize how many individual dimensions display on the widget chart, from 1-100. The value set here always applies to the drill down dimensions you configure.
- (Optional) To group and total any costs that are left over (if any) once “Results to display” has been applied, toggle Group remaining (if any) as “All Others”. This leftover total displays as “All others” in the widget.
- (Optional) To show any applied filters and their selected dimensions, toggle Display filter selections on widget.
- Configure the Widget Color Schema settings.
For more information, see Configuring Standard Widget Settings. - Select Save.
Compatible Dashboard-level Filters
Billing widgets are only affected by dashboard dynamic filters that correspond to existing Billing filter properties. If incompatible filters are applied on the Dashboards page, any active billing widgets do not return results. For more information on dashboard filters, see Dashboard Filters.
Only the following filter aliases and resource properties are supported by Billing widgets:
- Account (alias), system.norm.account (resource property)
- Application (alias), system.norm.application (resource property)
- Business Unit (alias), system.norm.business_unit (resource property)
- Environment (alias), system.norm.environment (resource property)
- Owner (alias), system.norm.owner (resource property)
- Provider (alias), system.device.provider (resource property)
- Region (alias), system.norm.region (resource property)
- Resource Type (alias), predef.externalresourcetype (resource property)
- Resource Type Category (alias), auto.resourcetypecategory (resource property)
- Tenant (alias), system.tenant.indentifier (resource property)
- Version (alias), system.norm.version (resource property)
