Monitoring Kubernetes Clusters with KSM
Last updated - 24 July, 2025
Disclaimer: Argus and Collectorset-Controller Helm Charts are being phased out. For more information to switching to the new LM Container Helm Chart for a simpler install and upgrade experiencere, see Migrating Existing Kubernetes Clusters Using LM Container Helm Chart.
kube-state-metrics (KSM) monitors and generates metrics about the state of the Kubernetes objects. KSM monitors the health of various Kubernetes objects such as Deployments, Nodes, and Pods. For more information, see kube-state-metrics (KSM) documentation.
You can now use the kube-state-metrics-based modules available in LM Exchange in conjunction with the new Argus and Collector Helm charts to gain better visibility of your Kubernetes cluster. The charts automatically install and configure KSM on your cluster and monitor the following resources:
- Daemonsets
- Replicasets
- Statefulsets
- PersistentVolumes
Note: By default, KSM is installed while installing Argus. Also, the newly added resources are monitored using KSM. For more information, see Installing KSM.
Enabling KSM Monitoring
To configure KSM, you must set the kube-state-metrics.enabled property to true in the Argus configuration file. In case the kube-state-metrics.enabled property is set to false, only active discovery for resources will work and the newly added resources will not be monitored.
For a detailed list of customizable properties, see kube-state-metrics Helm Chart.
Sample:
You must configure the following KSM properties in the values.yaml file:
# Kube state metrics configuration
# For further customizing KSM configuration, see kube-state-metrics Helm Chart.
kube-state-metrics:
 # Set enabled to false in case you want to use a custom configured KSM
 enabled: true
 # No. of KSM Replicas to be configured
 replicas: 1
 collectors:
 - daemonsets
 - replicasets
 - statefulsets
- persistentvolumesNote: By default, the collectors are enabled to monitor the new resources using KSM. You can also customize the KSM Helm Chart. For more information, see kube-state-metrics Helm Chart.
Installing KSM
If the kube-state-metrics.enabled property is enabled, KSM is automatically installed. In addition, you can configure KSM while installing Argus or while upgrading Argus.
Note: If you don’t want to install KSM while installing Argus, you can manually install KSM using CLI. For more information, see Installing KSM using CLI.
Installing Argus with KSM Monitoring
To configure KSM while installing Argus for the first time, complete the following steps.
Requirements
- Import PropertySources and DataSources to monitor the resources.
- Ensure that Openmetrics is enabled to monitor or support the new resources.
1. Navigate to Exchange > Public Repository and import the following PropertySource and DataSources from LM :
PropertySourceaddCategory_KubernetesKSM:
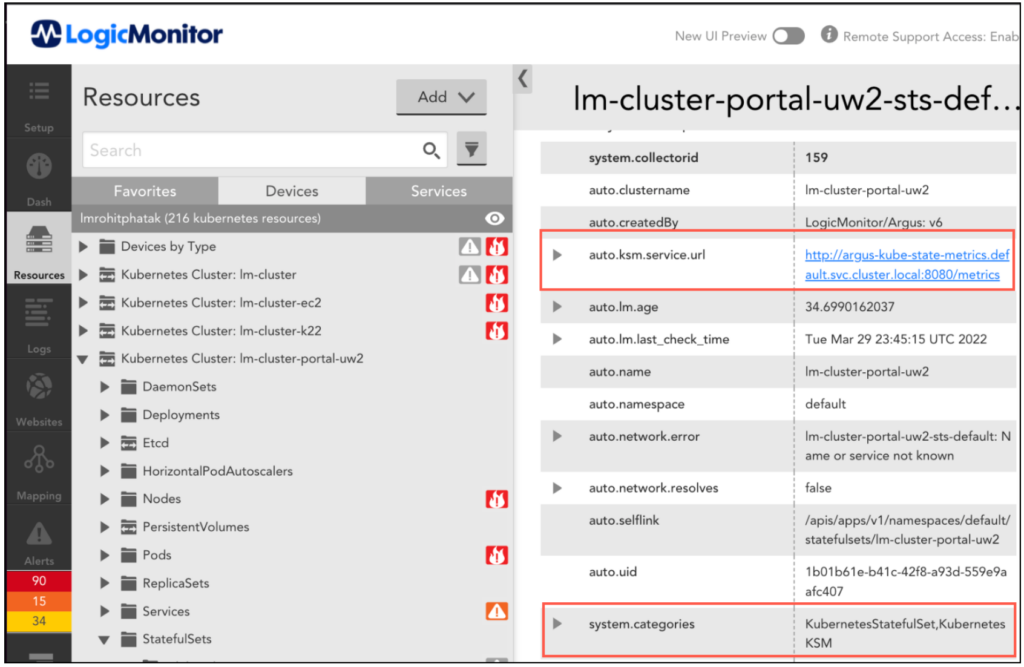
PropertySources checks if the kube-state-metrics service is configured on a cluster (through Argus or CLI) and sets the following properties on each Kubernetes resource:
KubernetesKSM– category to check if the resources can be monitored through kube-state-metrics.auto.ksm.service.url– kube-state-metrics service URL to get the metrics data. OpenMetrics DataSources uses the metrics data for monitoring Kubernetes resources.

DataSource
DataSources collects metrics from KSM in OpenMetrics format. These DataSources utilize metrics for representing data in graphs and for generating alerts. The following DataSources provide metrics for Daemonsets, Replicasets, Statefulsets, and Persistent Volumes PV respectively:
Kubernetes_KSM_DaemonsetsKubernetes_KSM_StatefulsetsKubernetes_KSM_ReplicasetsKubernetes_KSM_PersistentVolumes
In addition, these DataSources use the OpenMetrics server URL that is configured using addCategory_KubernetesKSM PropertySource.
2. Install Argus. For more information, see Argus Installation.
Upgrading Argus to Enable KSM Monitoring
To upgrade the existing cluster to the latest version of Argus to monitor new resources with KSM, complete the following steps.
Requirements
You must ensure that Openmetrics is enabled to monitor or support the new resources.
Note: To enable Openmetrics, contact your Customer Success Manager (CSM).
1. Navigate to Exchange > Public Repository and import the following PropertySource and DataSources from LM :
PropertySourceaddCategory_KubernetesKSM
DataSource
Kubernetes_KSM_DaemonsetsKubernetes_KSM_StatefulsetsKubernetes_KSM_ReplicasetsKubernetes_KSM_PersistentVolumes
2. Add the following KSM configuration properties into Argus values.yaml:
For example:
kube-state-metrics:
 # Set enabled to false in case you want to use a custom configured KSM
 enabled: true
 # No. of KSM Replicas to be configured
 replicas: 1
 collectors:
 - daemonsets
 - replicasets
 - statefulsets
- persistentvolumesFor more information, see kube-state-metrics Helm Chart.
3. Run the following command to upgrade Helm:helm repo update
4. Run the following command to upgrade Argus:helm upgrade --reuse-values -f argus-config.yaml argus logicmonitor/argus
5. Restart Argus Pod.
Note: You can also use CLI to install kube-state-metrics. For more information, see Installing KSM using CLI.
Installing KSM using CLI
Note: KSM is automatically installed when enabled in Argus charts. However, if you want to install KSM manually, run the following command to install kube-state-metrics using command-line arguments:
kube-state-metrics --telemetry-port=8081 --kubeconfig=<KUBE-CONFIG> --apiserver=<APISERVER> …Or configured in the args section of your deployment configuration in a Kubernetes or Openshift context:
spec:
  template:
    spec:
      containers:
        - args:
          - '--telemetry-port=8081'
          - '--kubeconfig=<KUBE-CONFIG>'
          - '--apiserver=<APISERVER>'

