
Resource Explorer Widget
Last updated – 31 March, 2026
The Resource Explorer widget provides quick access to resource health summaries generated by Resource Explorer. Create new custom views or load from saved Resource Explorer views to customize how you monitor resources from your dashboard. For more information, see Resource Explorer Overview.
Configuring a Resource Explorer Widget
- Create a Resource Explorer widget. For more information, see Widget Creation.
- In the Name field, enter a name to display at the top of the widget.
Note: If the widget name exceeds more than 64 characters, ellipses display. Widget names also cannot include the operators and comparison functions available in LogicMonitor’s datapoint expression syntax and names cannot contain commas (,), semicolons (;), or asterisks (*).
Use tokens as widget names to make cloning dashboards and updating widget information for the cloned dashboards easier. Inserting a dashboard Token into a Resource Explorer widget will apply that token name to the widget, but will not apply any existing filters.
- (Optional) In the Description field, enter a description for the widget to reference later in the Edit Widget form.
- (Optional) From the Refresh Frequency dropdown menu, select an interval for the widget data to update on (defaulted to 15 minutes).
- In the Edit Widget window, navigate to Resource Display and choose one of the following options:
- Select Load from saved views to choose an existing saved view from the dropdown menu. The Filter by and Group by fields will populate with the same filter/group properties applied to the saved view.
- Select Load from Shared Link to enter a URL generated by Resource Explorer. The Filter by and Group by fields will populate with the same filter/group properties applied to the shared link.
- Select filter/group options manually from the Filter by and Group by fields. Select Add in each field and choose properties to create a custom filter.
Note:
- If a Resource Explorer widget filter property is the same as the property in the Resource Explorer dashboard, the values in the dashboard property filter will override those of the widget, regardless of which was configured first. An icon appears on the widget to indicate the results are filtered.
- The alert status of each resource on the widget is based on the highest severity alert reported in the dashboard time range.
- In the Filter by field, you can filter the resources based on selected properties or aliases and their values.
- In the Group by field, you can group the resources by based on one or more properties.
Note: If no specific filters are applied, the widget will display the same default view as Resource Explorer.
- (Optional) Enable the Alert filters to customize which alert severities appear in the widget. Use the Alert datapoints to customize alert filters by including or excluding alert properties.
- In the Display Settings section, toggle the Display filter selections on widget switch to apply your current filter selections to the widget.
- Select one of the following options in the Visualization Layout dropdown menu, :
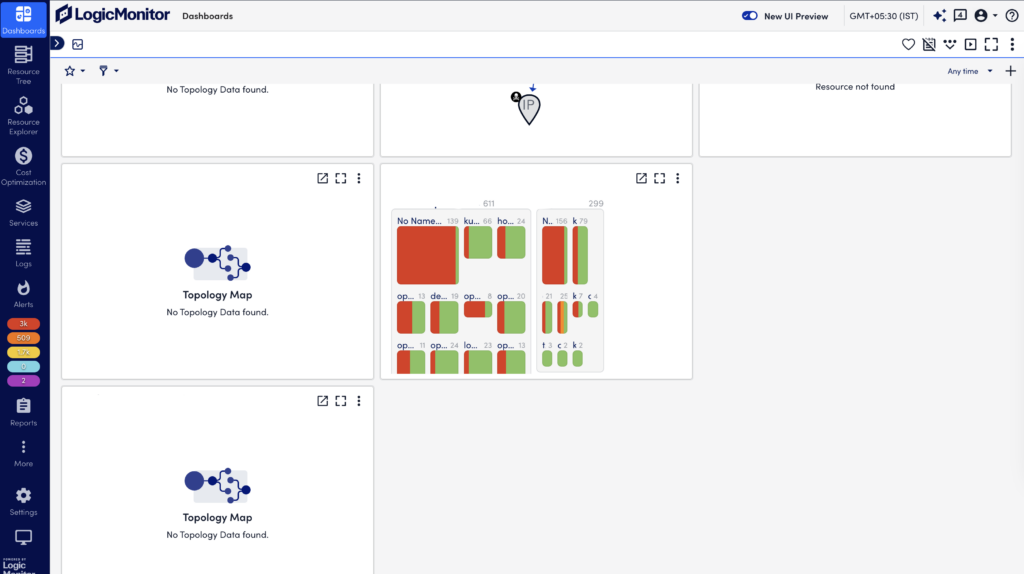
- Hive—Displays resources as hexagonal icons that indicate resource health, organized by filter and group properties. Hover over an icon to view resource details, or select to open in Resource Explorer.
- Table—Displays resources as a table of resource details, organized by filter and group properties. Expand a row to view nested resource details, or select View in Resource Explorer.
- Select a font size for the labels displayed on the widget, from “X-Small” to “X-Large” in the Group label font size dropdown menu.
- Select the size of the visualization within the widget, from “50%” to “150%”, in the Visualization zoom level dropdown menu.
- Select Save to apply the configuration.
