
SDT Inventory Report
Last updated - 04 December, 2025
The SDT Inventory report enables you to view detailed information about the Scheduled Downtime (SDT) for resources, services, and websites. This enables you to view these details in a single, configurable report. The report displays the user who scheduled the downtime, the type of SDT (for example, “DeviceGroup”), start and end times of the SDT, and the duration of the SDT. You can also view both active and historical SDT.
When you configure the report, you specify a time range for the data, and then define either a resource or website to collect the SDT values for. In addition, you can choose a user so the report displays SDTs based only on the user that placed a resource or website in SDT.
You can choose to generate the report on a schedule or ad-hoc.
Note: The maximum time range for an ad-hoc report is limited to 30 days.
Configuring the SDT Inventory Report
- In LogicMonitor, navigate to Reports.
- Select + > Add Report > select Add for the SDT Inventory report.
- In the Name field, enter a name for the report.
Report names cannot include the operators and comparison functions used in LogicMonitor’s datapoint expression syntax. - (Optional) In the Description field, enter a description for the report.
For example, you can enter a description of the specific purpose of the report. - From Report Group, select the report group where your report is stored.
Matching groups display as you type, and you can select the group from the list. - From Format, select the type of format for the output of the report.
You can select HTML, PDF, or CSV.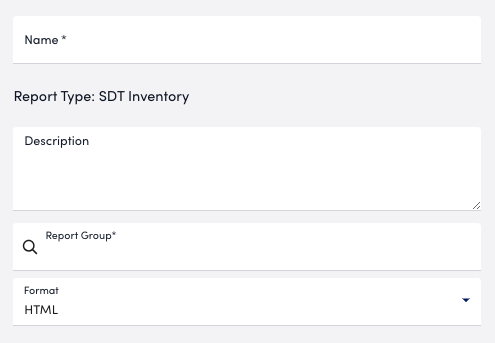
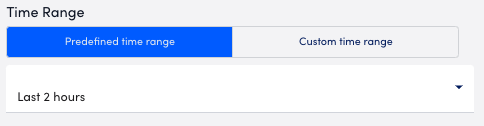
- In the Time Range settings, do one of the following to configure the time range that you want the report to display information for:
- Choose Predefined time range, and then select a time range.
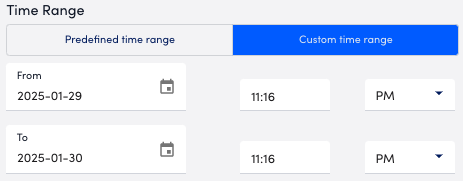
- Choose Custom time range, and then configure the following:
- Enter or choose a date in the From field, and then configure the settings to define the time you want the report to start at.
- Enter or choose a date in the To field, and then configure the settings to define the time you want the report to end at.
- Choose Predefined time range, and then select a time range.
- Do one of the following to base the SDT Inventory report on resources or websites:
Note: You can configure an SDT Inventory report for either a resource or a website. You cannot base the report on both resources and websites.
- Choose Resource, and then do the following:
- In the Resources Filtering settings, enter the name of a resource group from the Resource Group field and the name of a resource from the Resources field. LogicMonitor attempts to match values as you type. Alternatively, you can enter a wildcard (“*”) for resource group to include all groups in the report in addition to the specified resource.
- (Optional) In the DataSources Filtering settings, enter the name of a DataSource from the DataSource field and the name of the instance from the Instance field.
LogicMonitor attempts to match values as you type.
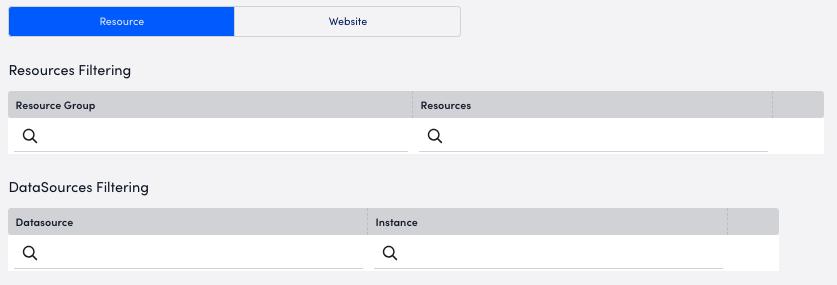
Note: If you do not specify a DataSource, the report includes all relevant SDT data based on the Resource Filtering settings, such as BatchJob, EventSource, ClusterAlertDef, and DataSource instance group.
-
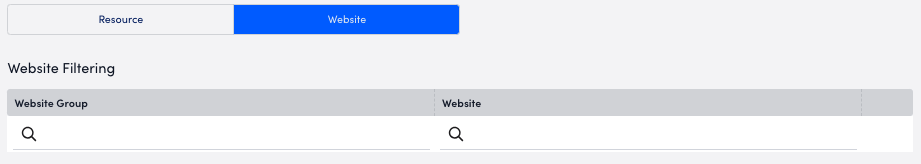
Choose Website, and then enter the name of a website group from the Website Group setting and the name of the website from the Website field.
LogicMonitor attempts to match values as you type.
Alternatively, you can enter a wildcard (“*”) for website group to include all groups in the report in addition to the specified website.
- (Optional) To filter the SDT information for a specific user, enter the name of the user In the User field.
LogicMonitor attempts to match values as you type. - In SDT Filter Settings, do the following:
- Toggle on Include active SDT values to include all active SDT instances from the configured timeframe.
- Toggle on Include historical SDT values to include all historical SDT instances from the configured timeframe.
Note: Toggling both switches enables the report to include a Status column that displays active and historical SDT values. Both switches must be toggled to display the Status column.
- In Report Schedule settings, do the following to configure the report to generate on a schedule:
- From Frequency, select how frequent you want the report to generate, and then configure when you want the report to generate.
For example, if you configure the report to generate daily, you can choose the time to generate the report each day. If you configure the report to generate weekly, you can choose the day of the week and time to generate the report for the selected date. If you configure the report to generate monthly, you can configure the day of the month and time to generate the report.
Each frequency option provides you a setting for selecting the time zone. - In Recipients Email, enter the name of the user you want to receive the generated report. You can also add recipient groups.
You can enter as many users as needed.
LogicMonitor attempts to match values as you type.
The recipients you add to the report are emailed a generated report based on the format you configured and the email associated with the username.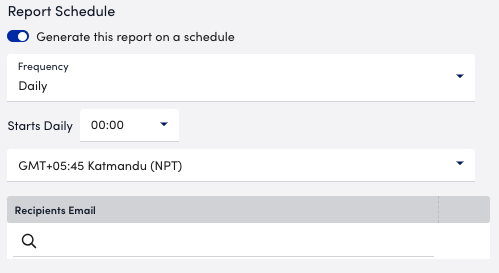
- From Frequency, select how frequent you want the report to generate, and then configure when you want the report to generate.
- Do one of the following to save the report:
- Select Save.
The report saves to the Report Group you selected.
If you configured the report to generate on a schedule, the report generates and sends to recipients based on the frequency you configured. - Select Save and Run.
The report saves to the Report Group you selected and generates a report based on the format you configured.
If you configured the report to generate on a schedule, the report generates and sends to recipients based on the frequency you configured.
- Select Save.
