
Cluster Alert Tuning Tab
Last updated - 25 July, 2025
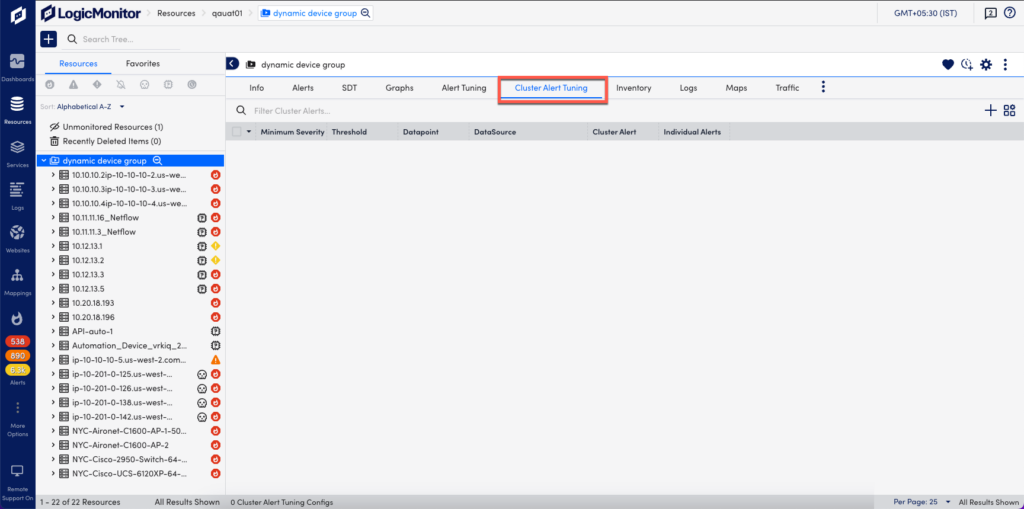
The Cluster Alert Tuning tab is available when you select a Resources group.
Cluster alerts monitor and alert on datapoints across multiple resources in a resource group. They are designed to provide quick insight into the overall state of a collection of devices or cloud resources. For example, this can be useful when you have a pool of resources that are serving an application or performing a task; while you may not be too concerned with an issue that affects a single resource in the pool, you’ll likely want to know immediately if the pool of resources as a whole is at risk of not being able to serve its purpose. In a case like this, you could configure a cluster alert to trigger when five batch servers have CPU usage rates higher than 80%.
Cluster alerts trigger based on the presence of individual alerts for devices or instances belonging to the same group of resources. For example, using the scenario provided in the previous paragraph, five batch servers in the group would need to have 80% set as an alert threshold for CPU usage and would need to have exceeded that threshold in order for the cluster alert to trigger. Because cluster alerts rely on individual datapoint alerts, it’s important that you keep datapoint thresholds tuned, as discussed in Tuning Static Thresholds for Datapoints.
Note: Cluster alerts are a simple way to measure the overall health of a group of resources. For more sophisticated monitoring and alerting capabilities across groups of resources, consider LM Service Insight, a feature that groups instances across one or more monitored resources (e.g. devices) into logical “Services”. For more information, see About LM Service Insight.
You can perform multiple actions such as adding cluster alerts, managing cluster alerts, and sending test alert notifications. For more information, see Cluster Alerts, Cluster Alerts Management, and Cluster Alerts Routing and Notification.
