Usage Data for LM Logs
Last updated - 17 March, 2026
Note: Depending on your licensing agreement, the product name displayed in your portal for LM Logs might display as “LM Inspector” or “LM Logs Enterprise.” All names refer to the same core logs ingestion and reporting functionality.
The LM Logs Usage page provides detailed insights into log data consumption across your portal. It enables you to analyze total log ingestion, understand usage across retention plans, review partition-level contributors, and visualize trends over time.
Usage Reporting for LM Logs offers the ability to do the following:
- View cumulative log ingestion for the portal or for specific partitions
- Compare usage across subscription types (for example, Yearly Retention versus 7-Day Retention)
- Monitor usage growth and track month-to-date ingestion
- Identify top contributors to log volume through predefined usage analysis queries
For more information on visual components, see Visual Components for Usage Reporting.
LM Logs aggregates log ingestion data and presents the following key metrics:
| Source of Data | Description |
| Portal Total (LM Logs Ingest Metrics) | Total volume of log data ingested across the portal month-to-date |
| Partitions (Tenant.Identifier) | Logs ingestion group by partition, helpful for MSP or multi-tenant environments |
| Top Usage Analysis (Predefined LM Log queries) | Lists top log contributors by log source, query, or partition |
| Retention Breakdown | Displays ingestion volumes store in each subscription type (For example, Yearly retention, 7-Day Retention) |
Billings and Usage Calculation for LM Logs
LogicMonitor calculates LM Logs usage based on the total volume of log ingestion, measured in gigabytes (GB).
Depending on your subscription type, log data is billed through one of the following models:
| LM Logs Usage License | Description |
| Usage Per Retention Plan | Usage is measured as the monthly average ingestion volume for all log data stored in each retention plan. This includes the following:All log data ingested from monitored resources, applications, or servicesLog data stored in “Yearly Retention” or “7-Day Retention”Partition-level data aggregation (when applicable). Note: LM Logs counts all ingested log volume without exposing the content or identity of individual log events |
| Usage Per Partition (MSP/ Multitenant) | Billing can be tracked by partition. Monthly ingested per tenant, enabling sub-tenant chargeback and reporting. Note: The Usage Contributors table surfaces per-partition totals for transparent comparison. |
Requirements for Viewing Usage Data for LM Logs
To view usage data for LM Logs, you need the following:
- LM Logs Enterprise or LM Inspector subscription
- Logs Partition must be configured in your environment
For more information, see Logs Partition.
If your environment provides services for multiple LogicMonitor Accounts, you must have a LogicMonitor user with permission to “View” all child accounts or specific Partitions (Tenant.Identifier) data.
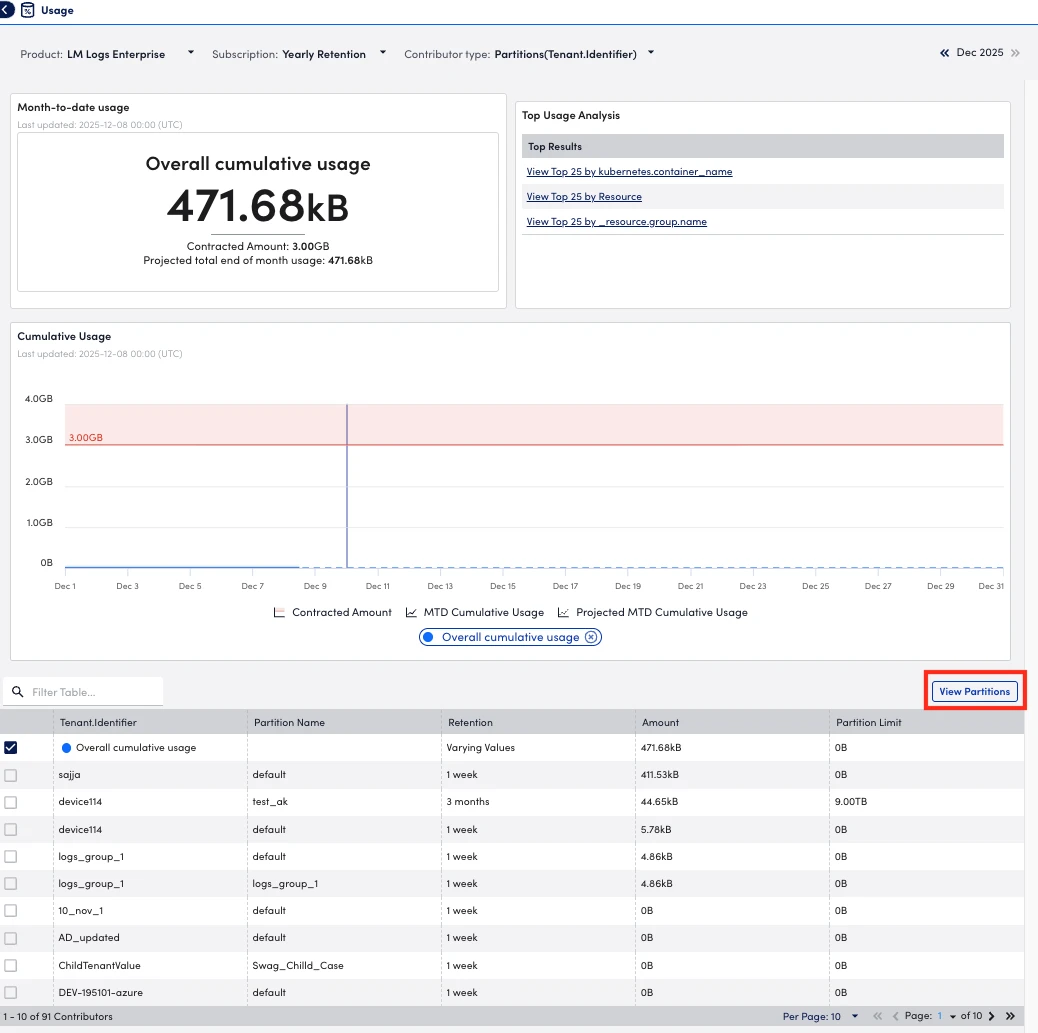
Viewing Usage Data for LM Logs
- In LogicMonitor, navigate to Settings > Usage.
- Select “LM Logs Enterprise” or “LM Inspector” from the Product dropdown menu.
Note: Depending on your licensing agreement, the product name displayed in your portal for LM Logs might display as “LM Inspector” or “LM Logs Enterprise.”
- Select the month you want to view usage for.
- To interact with the Usage Contributors table, select a contributor from the Contributor Type dropdown menu.
For more information, see Usage by Contributor. - To view usage by a specific subscription plan, select one of the following from the Subscription dropdown menu:
- Yearly Retention—Usage for logs stored with 12-month retention
- 7-Day Retention—Usage for logs stored with 7-day retention
- Monthly Retention—Usage for logs stored with the select month’s retention
- 90-Day Retention—Usage for logs stored with 90-day retention
- To identify and view usage metrics for your highest-volume log sources, select one of the following from the Top Usage Analysis summary:
- View Top 25
kubernetes.containter_name—Displays the 25 containers generating the most logs - View Top 25 Resource—Displays the 25 monitored resources contributing the most log volume
- View Top 25 by
_resource.group.name—Displays the 25 resource groups with the highest log ingestion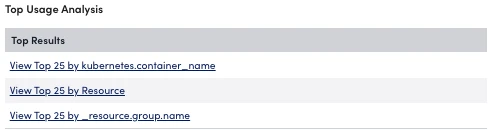
- View Top 25
Note: Navigating to LM Logs from the Usage page displays the logs for the last 24 hours.
- To view detailed information on your partitions, select View Partitions.
Your log partitions page opens in another tab.