
Usage Reporting for APM Traces
Last updated – 17 March, 2026
You can leverage Usage Reporting to view the usage metrics for APM Traces directly in your LogicMonitor portal. LogicMonitor displays the metrics using spans as an overall cumulative usage metric.
Billing and Calculations for APM Traces
APM Traces billing is based on the total number of spans ingested during the selected billing period. The following table explains how APM Traces usage is measured and applied to billing.
| Usage Element | Description | How it Affects Billing |
| Span | A single operation within a distributed trace (for example, a service call or request segment) | Each span counts as one unit toward usage |
| Trace | A collection of related spans that represent a complete transaction | Billing is based on spans, not traces |
| Span Ingestion | The process of receiving spans from monitored applications | All ingested spans contribute to usage |
| Monthly Span Total | Total number of spans ingested during the selected month | Used for billing calculations |
| Cumulative Usage | Aggregated span usage displayed over time | Reflects the span total applied to billing |
Note: Billing is calculated using the total number of spans ingested during the month, regardless of how spans are grouped into traces or displayed in Usage Reporting.
Requirements for Viewing Usage Data for LM Logs
To view usage data for APM Traces in Usage Reporting, you must subscribe to APM Traces.
Viewing Usage Data for APM Traces
- Navigate to Settings > Usage.
- From the Products option, select “APM Traces.”
- To interact with the Usage Contributors table, select “All Child Accounts” from Contributor Type.
Note: APM Traces does not support tenant.id at this time.
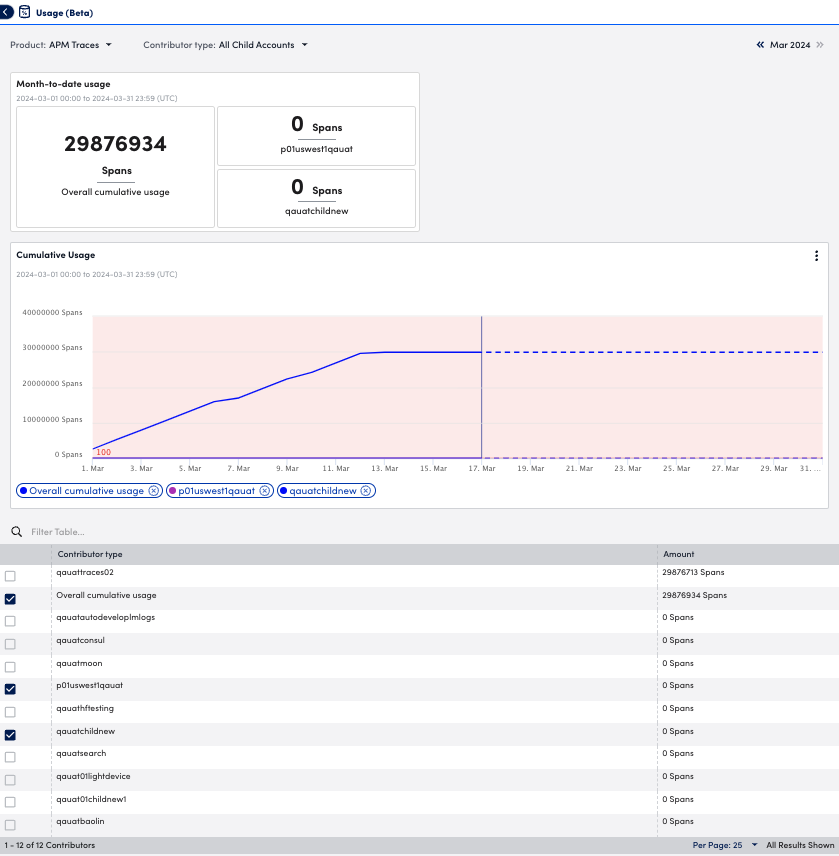
- Select the month you want to view usage for.
- To view usage in a sparkline or bar graph format in the Cumulative Usage graph, select the type of graph from the Options menu of the Cumulative Usage graph.
Note: If “All Child Accounts” is selected from Contributor Type, you must select a contributor from the Contributor Type table to display data in the Cumulative Usage graph.
