Explore Page
Last updated - 17 December, 2025
The Explore page provides a centralized view of insights, alerts, and events to help you understand system behavior, identify anomalies, and troubleshoot more effectively.
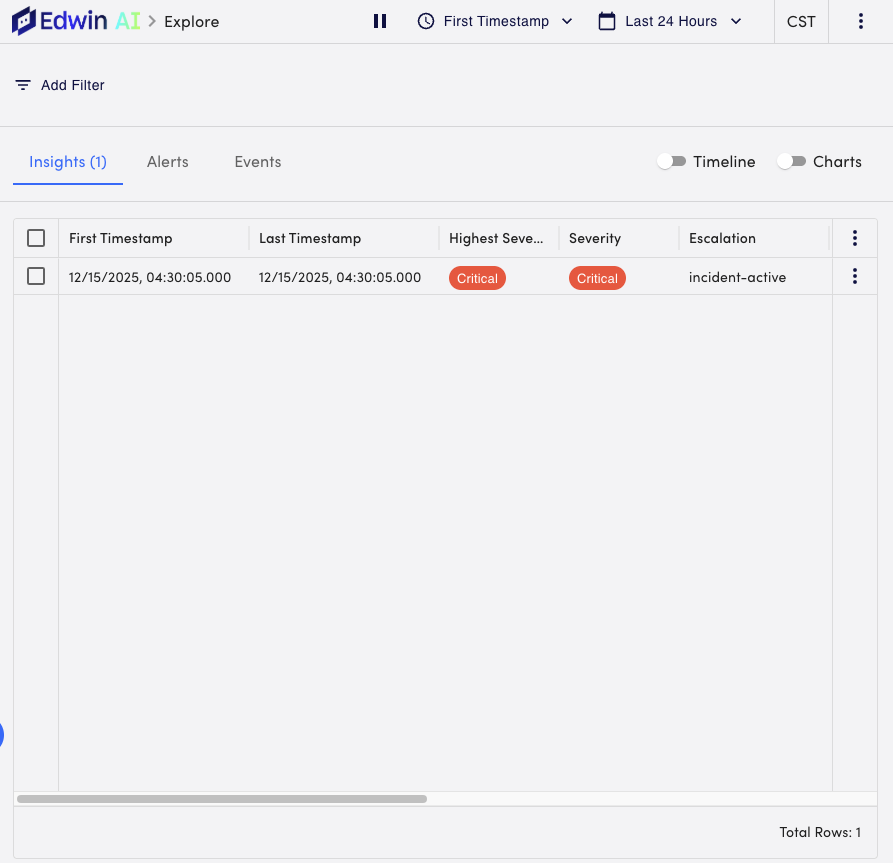
The Explore page offers a different lens for the following in your Edwin AI environment:
- Insights—Surfaces AI-driven insights that highlight trends, unusual patterns, and potential issues.
This view helps you understand what correlations have formed and what Insights should be reviewed, reducing time to root cause and improving decision-making.
For more information, see Insights. - Alerts—Displays active and historical alerts relevant to the selected context.
This tab helps you assess alert volume, identify recurring issues, and prioritize remediation efforts.
For more information, see About Alerts. - Events—Displays ingested events received by Edwin AI.
This enables you to see correlation between configuration changes, service updates, or environmental shifts and their operational impact.
For more information, see Events.
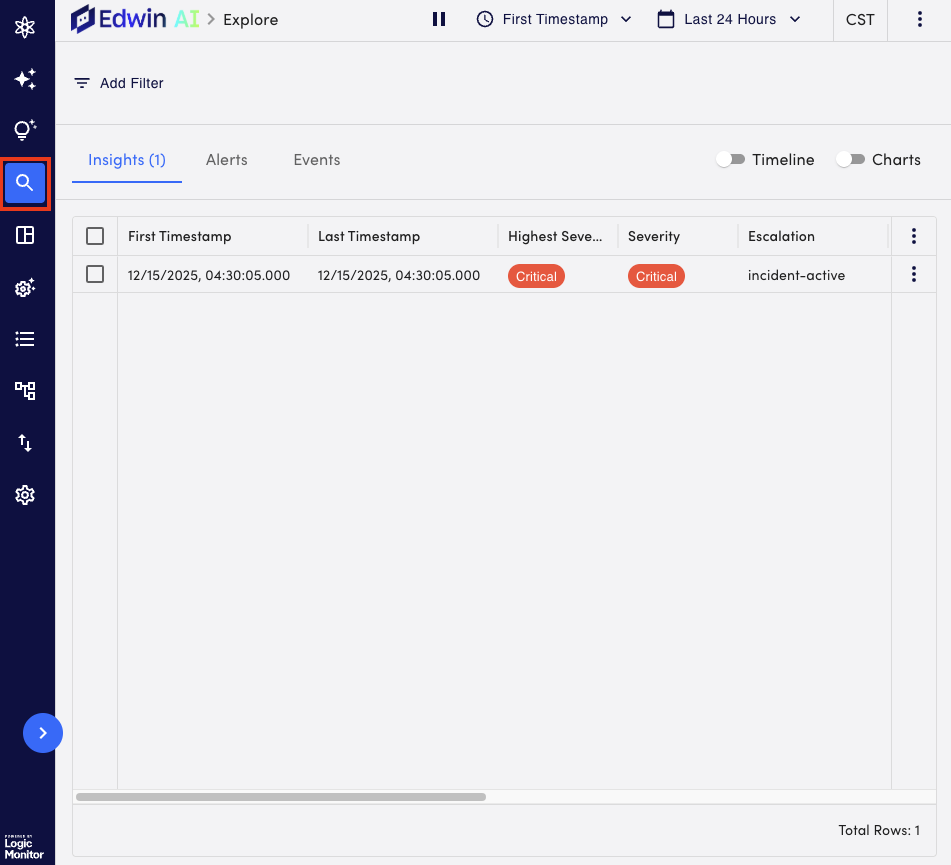
Navigating to the Explore Page
- In LogicMonitor, navigate to Edwin AI > select Explore from the navigation sidebar.