Viewing Alerts from a Mobile Device
Last updated - 23 July, 2025
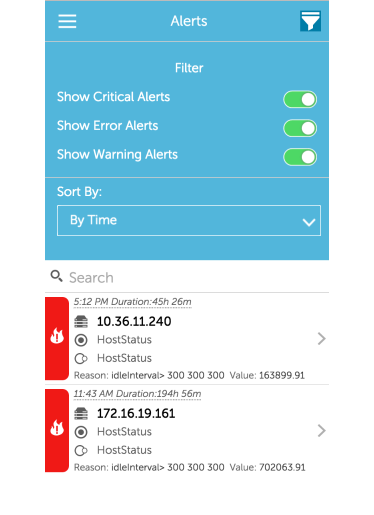
Upon a successful login you will see a list of alerts for your account, sorted by date with the most recent at the top.
To filter the alert list view by alert severity and sort by alert timestamp or severity, select the filter icon in the top right hand corner:
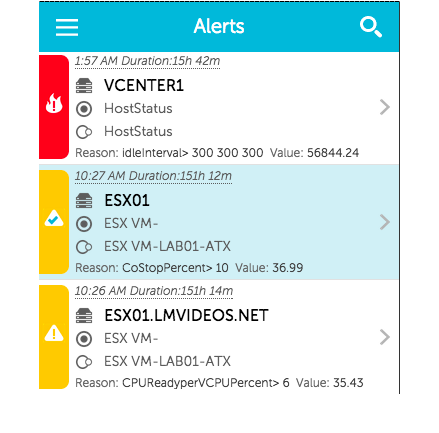
Understanding the alert list view:
For each alert:
- start time and duration are displayed at the top
- reason identifies the datapoint and associated thresholds that triggered the alert
- value specifies the value of the datapoint
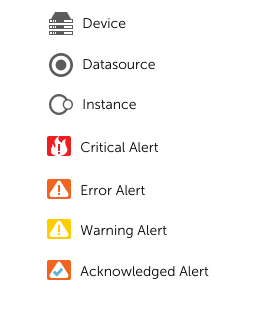
- device, datasource, instance, and alert severity are displayed according to the following icon legend:
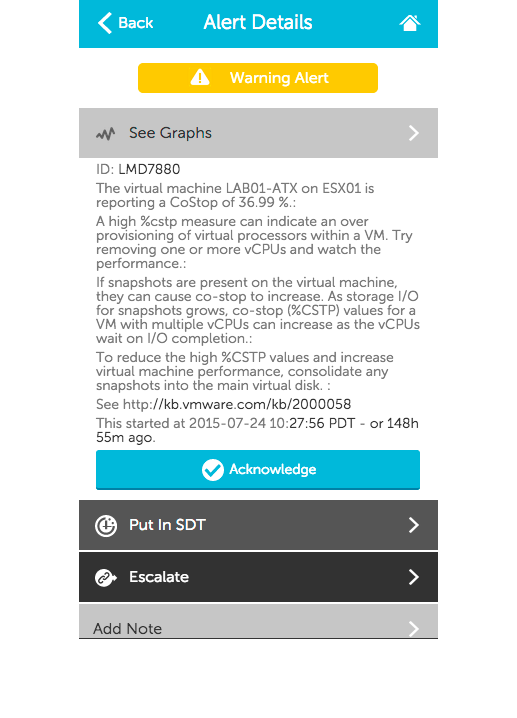
View Alert Details
Select or swipe an alert to see the alert details. The alert details include the alert id, datapoint value, any relevant troubleshooting tips, and the options to respond to the alert or see graphs associated with the data that triggered the alert.