Nginx Monitoring
Last updated - 24 July, 2025
To collect information about the number of requests, busy threads, etc from Nginx, LogicMonitor must be able to pull the status page. Ensure Nginx is compiled with the stub_status module, and that the Nginx configuration file is set to allow the collector to pull the server status page, by a section such as the following in the nginx.conf:
location /nginx_status {stub_status on;access_log off;allow COLLECTOR.IP.ADD.RESS;deny all;}
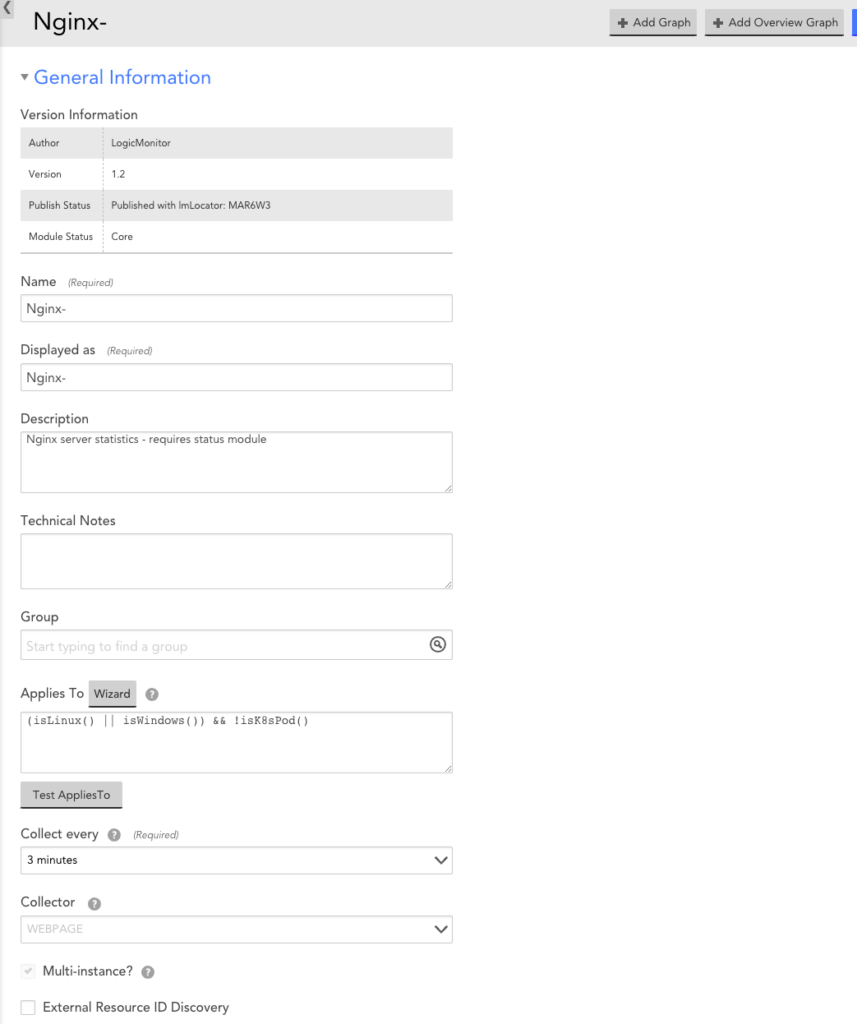
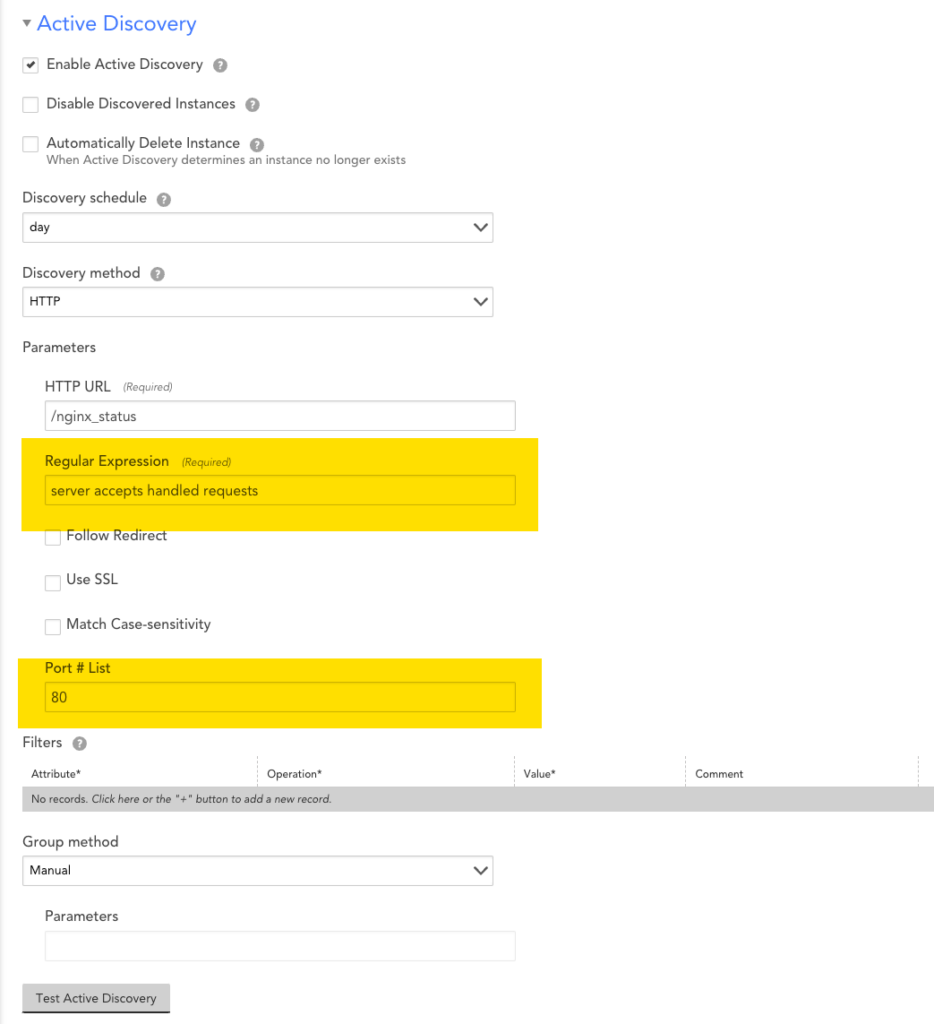
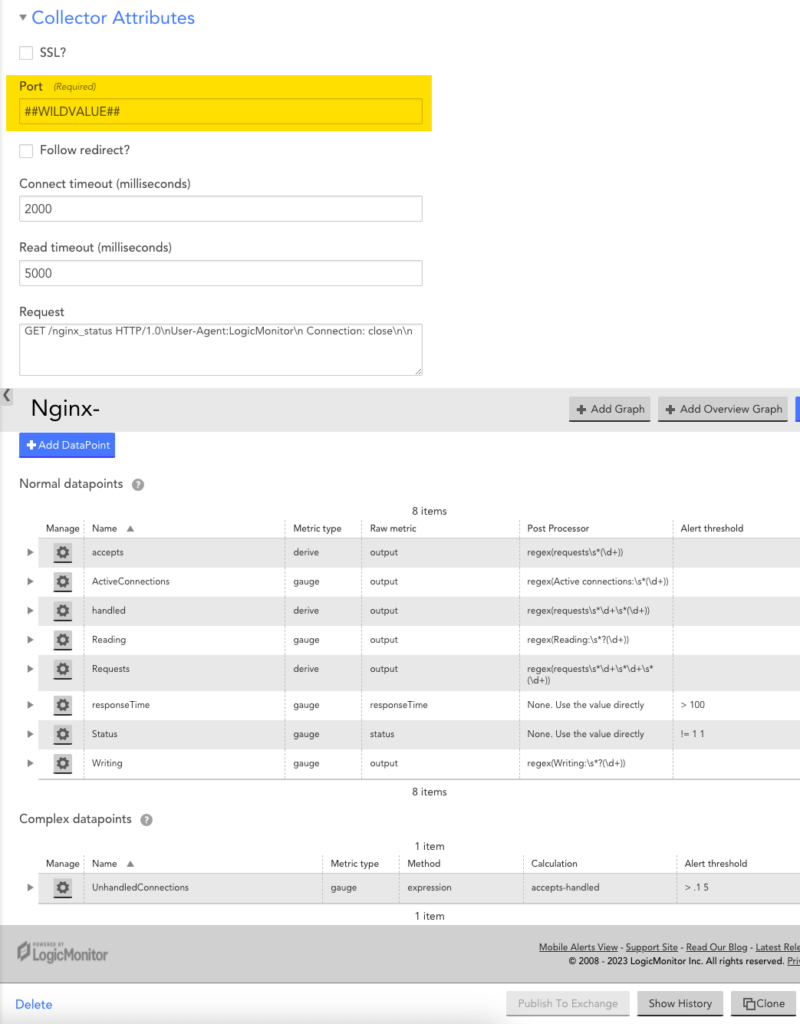
If you set the location of the status page to location other than /nginx_status, you will need to update the Nginx datasource. Change the location in the Active Discovery and Collector Attributes sections, as shown:


If the status page is accessible from by the collector, LogicMonitor will discover the Nginx server, and start monitoring it. You may want to manually run Active Discovery to force discovery.


