Generative AI Application Monitoring
Last updated - 14 October, 2025
Large Language Models (LLMs), AI chatbots, and other GenAI-powered applications require real-time monitoring to perform reliably and accurately. Generative AI (GenAI) application monitoring by LogicMonitor enables you to monitor essential metrics, identify issues early, and optimize model performance at scale. With support for OpenLIT and Traceloop metrics and traces, LogicMonitor OpenTelemetry Collector (OTEL) delivers complete observability for LLM and GenAI applications. For detailed information, see OpenLIT Metrics from OpenLit and What is OpenLLMetry? from Traceloop.
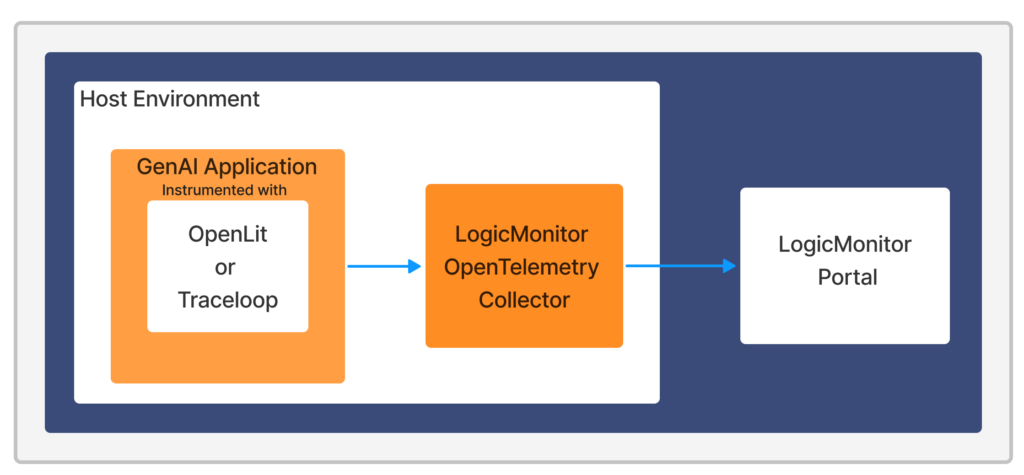
The following image illustrates the GenAI application monitoring workflow:

Setting up GenAI Application Monitoring involves the following:
- Instrument your application using OpenLit or Traceloop
- Configuring LM OTEL Collector
Requirements for Monitoring GenAI Application Metrics
To view GenAI application metrics, you need the following:
- Latest version of OpenLit or Traceloop installed. For more information on installation instructions, see Monitor AI Applications using OpenTelemetry and What is OpenLLMetry for OpenLit and Traceloop respectively.
- LogicMonitor OpenTelemetry Collector (lmotel) 5.1.00 or later installed.
- Manage permissions of the following Settings:
- Data Ingestion > Traces
- OpenTelemetry Collectors
DataSources are created with the Push Metrics API by the OpenTelemetry Collector.
For more information, see Roles.
Instrumenting your Application using OpenLit
- Enter the following lines to your application code at the beginning of the file:
The OpenLit Metrics are sent to the LM OTEL Collector through OpenTelemetry Protocol (OTLP).
import openlit
import os

if not os.path.exists(pricing_path):

    print(f"Warning: {pricing_path} not found. Using default pricing configuration.") #optional

OTLP_ENDPOINT = os.getenv("OTEL_EXPORTER_OTLP_ENDPOINT", "http://localhost:4318")

print("openlite initializing...") #optional

openlit.init(

    otlp_endpoint= OTLP_ENDPOINT,

    collect_gpu_stats=True,

    pricing_json=pricing_path if os.path.exists(pricing_path) else None

)

print("openlite initialized") #optional - Add the
OTEL_EXPORTER_OTLP_ENDPOINTenvironment variable to configure the endpoint dynamically.
For example, add the following URL:
export OTEL_EXPORTER_OTLP_ENDPOINT="http://localhost:4318"- Add the
OTEL_RESOURCE_ATTRIBUTESenvironment variable to report or attach the metrics to a particular resource. This sends the displayname of the resource as the host.name in the LM Resource attributes.
For example:
export OTEL_RESOURCE_ATTRIBUTES="host.name=US-W2:GenAI_App_i-06a9a8c9e10ece23b"If the OTEL_RESOURCE_ATTRIBUTES environment variable is not available, then a new resource with the hostname of the LM OTEL Collector is created and the metrics are attached to it.
Recommendation: You can check the hostname at system.displayname property for your resource on the LogicMonitor portal.
Instrumenting your Application using Traceloop
- Enter the following lines to your application code at the beginning of the file:
The Traceloop Metrics are sent to the LM OTEL Collector through OpenTelemetry Protocol (OTLP).
from traceloop.sdk import Traceloop
import os

print("Traceloop initializing...") #optional

Traceloop.init(
    disable_batch=True, should_enrich_metrics=False, resource_attributes={"host.name": "<enter your resource display name>"})


print("Traceloop initialized") #optional- Add the
TRACELOOP_BASE_URLenvironment variable to configure the endpoint dynamically.
For example, add the following URL:
export TRACELOOP_BASE_URL="http://localhost:4318"Configuring the LM OTEL Collector
- In LogicMonitor, navigate to Settings> OpenTelemetry Collectors.
- Select
 in the Actions column to edit an existing LM OTEL Collector.
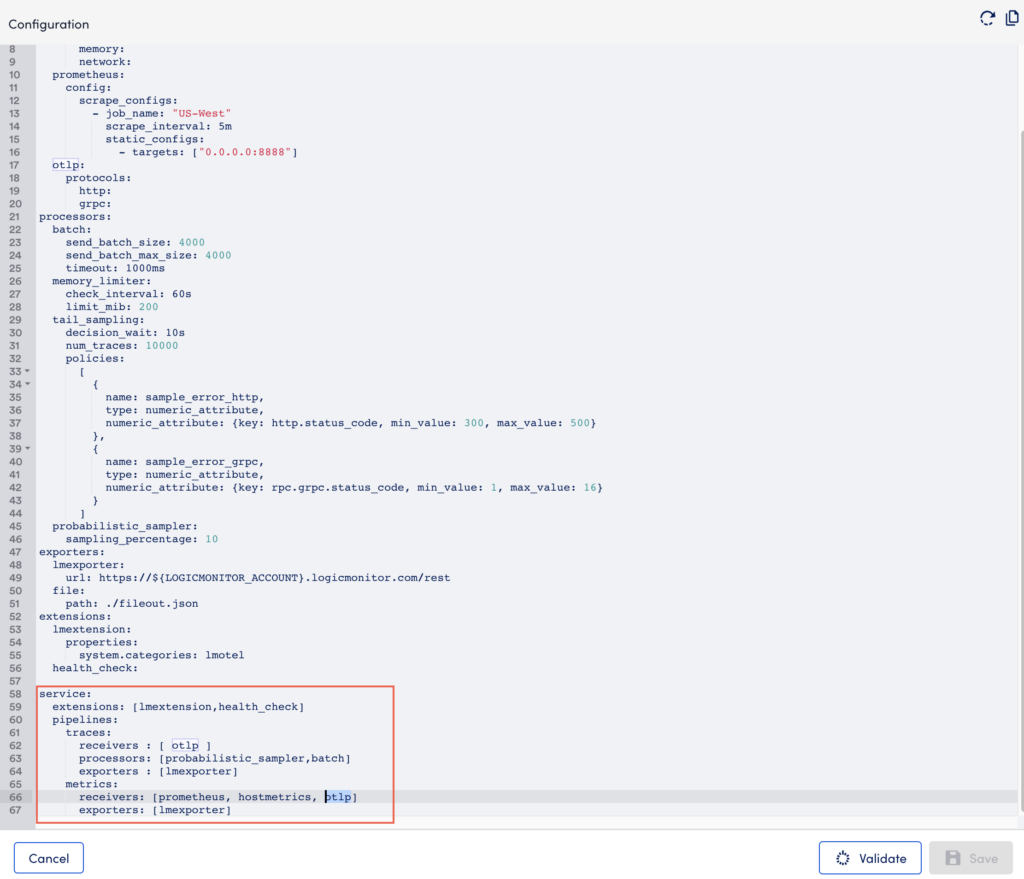
Note: If you are installing a new LM OTEL Collector, directly replace it with the following code for the service section during the Review Configuration section in the LM OTEL Collector configuration wizard.
- In the configuration file, replace the service section with the following code:
service:
  pipelines:
    traces:
      receivers: [otlp]
      processors: [batch]
      exporters: [lmexporter]
    metrics:
      receivers: [otlp]
      exporters: [lmexporter]
- Select Validate and then Save.
Viewing the Monitored GenAI Application Metrics
- In LogicMonitor, navigate to Resource Tree > select an OpenLit or Traceloop resource.
Note: Search the datasource using the resource name.
- Select the different resource tabs to view the associated information.
For example, select the Raw Data tab to view the raw data on the associated properties.
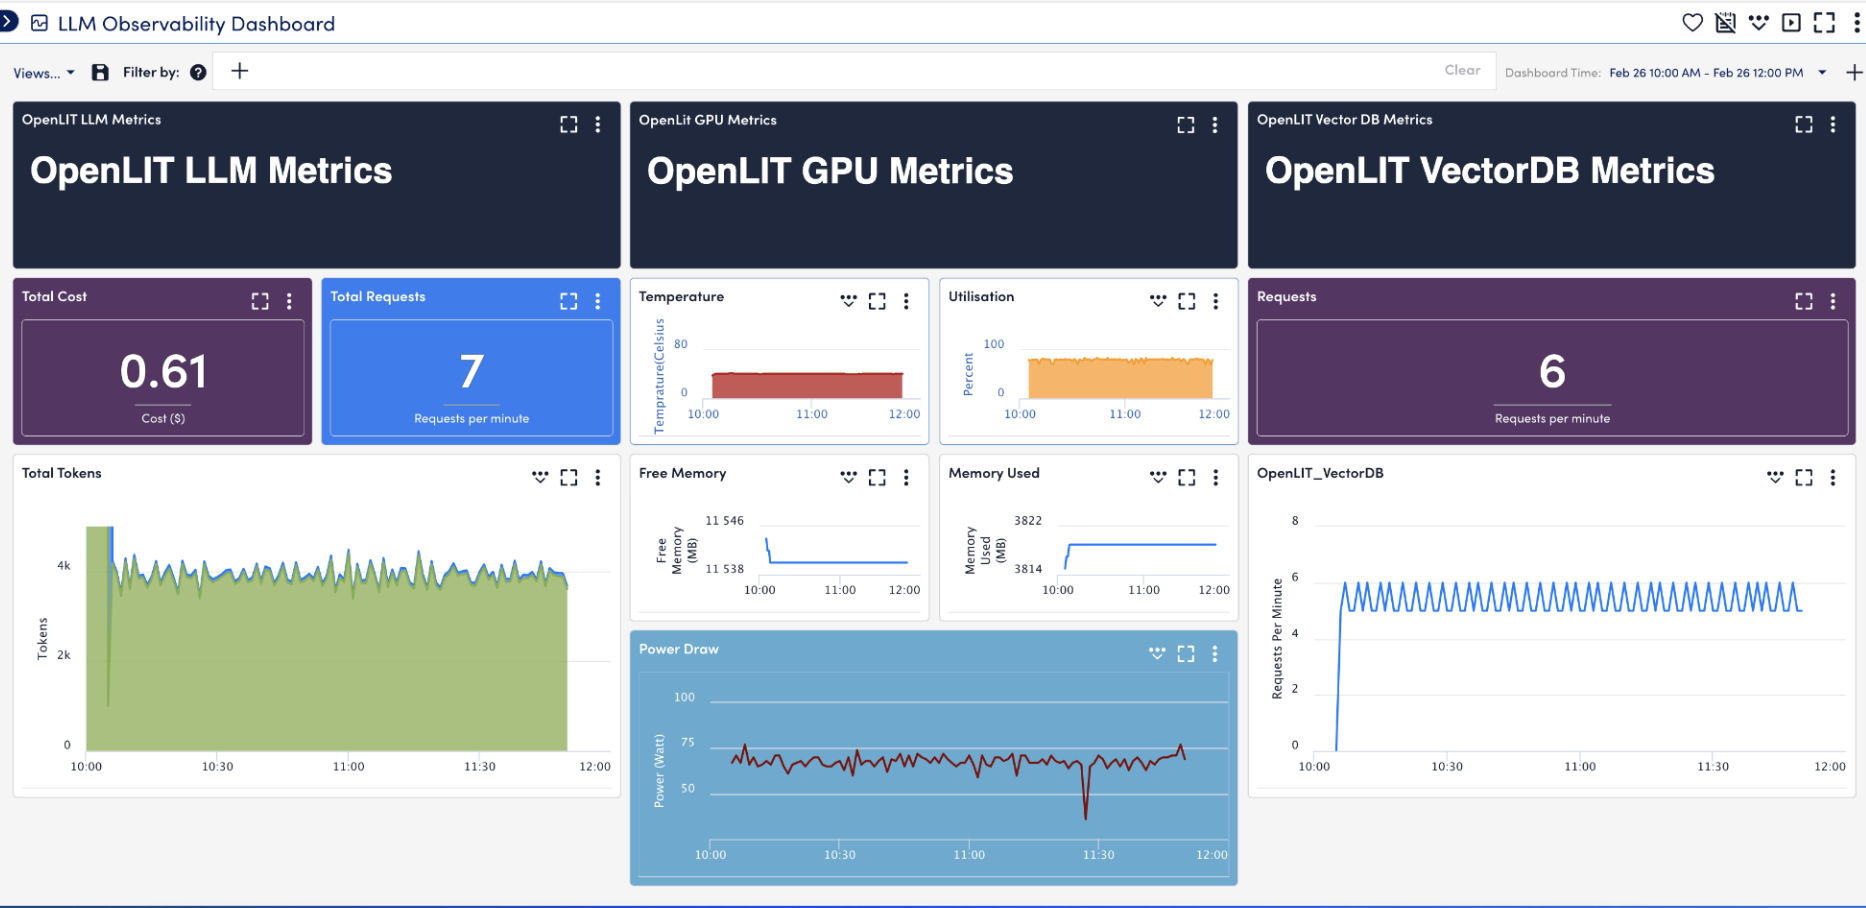
These metrics can also be viewed using dashboards. For more information, see Dashboard Creation.


