
Query Language Overview
Last updated – 16 April, 2026
The LM Logs Query Bar provides an interactive interface where you can enter log queries to retrieve relevant log results. You can filter log data with precision and flexibility using either natural language inputs or Logs query language. It enables you to rapidly troubleshoot and investigate issues, from diagnosing failed authentications to identifying system reboots or backup failures.
You can filter log data by fields such as _message, severity, _resource.name, and custom log fields, using Boolean operators, regular expressions, and time-based filters.
Natural Language Query with LogPilot
The natural language query feature enables you to type intuitive, conversational phrases to search logs without memorizing query syntax. LogicMonitor automatically translates your natural language input into the corresponding logs query equivalent. This feature simplifies exploration and makes it easier for new users to start filtering log data.
For example, you can type “show error logs from web servers” to generate a structured query automatically.
For more information, see LogPilot in the product documentation.
Log Query Language
The Logs query language expands the standard search capabilities beyond keyword searches and filtering by resource, group, pipeline, and time range. The additional flexibility includes combining filters with logical operators, filtering events based on fields and values parsed from your logs, and matching patterns with glob expressions and regular expressions. You can also summarize activity from log messages over a time range for reporting or alerting.
The Logs query language supports the following operators and expressions:
- Field/value matching (for example, severity=”ERROR”)
- Logical operators (for example, AND, OR, NOT)
- Pattern matching regular expressions (for example, =~ (match), !~ (does not match))
- Time-based filters (for example,
_time > now() - 1h)
Note: LM Logs does not support != for field inequality.
To exclude values, use the NOT logical operator (e.g., NOT field=”value”)
For more information, see Writing a Log Query.
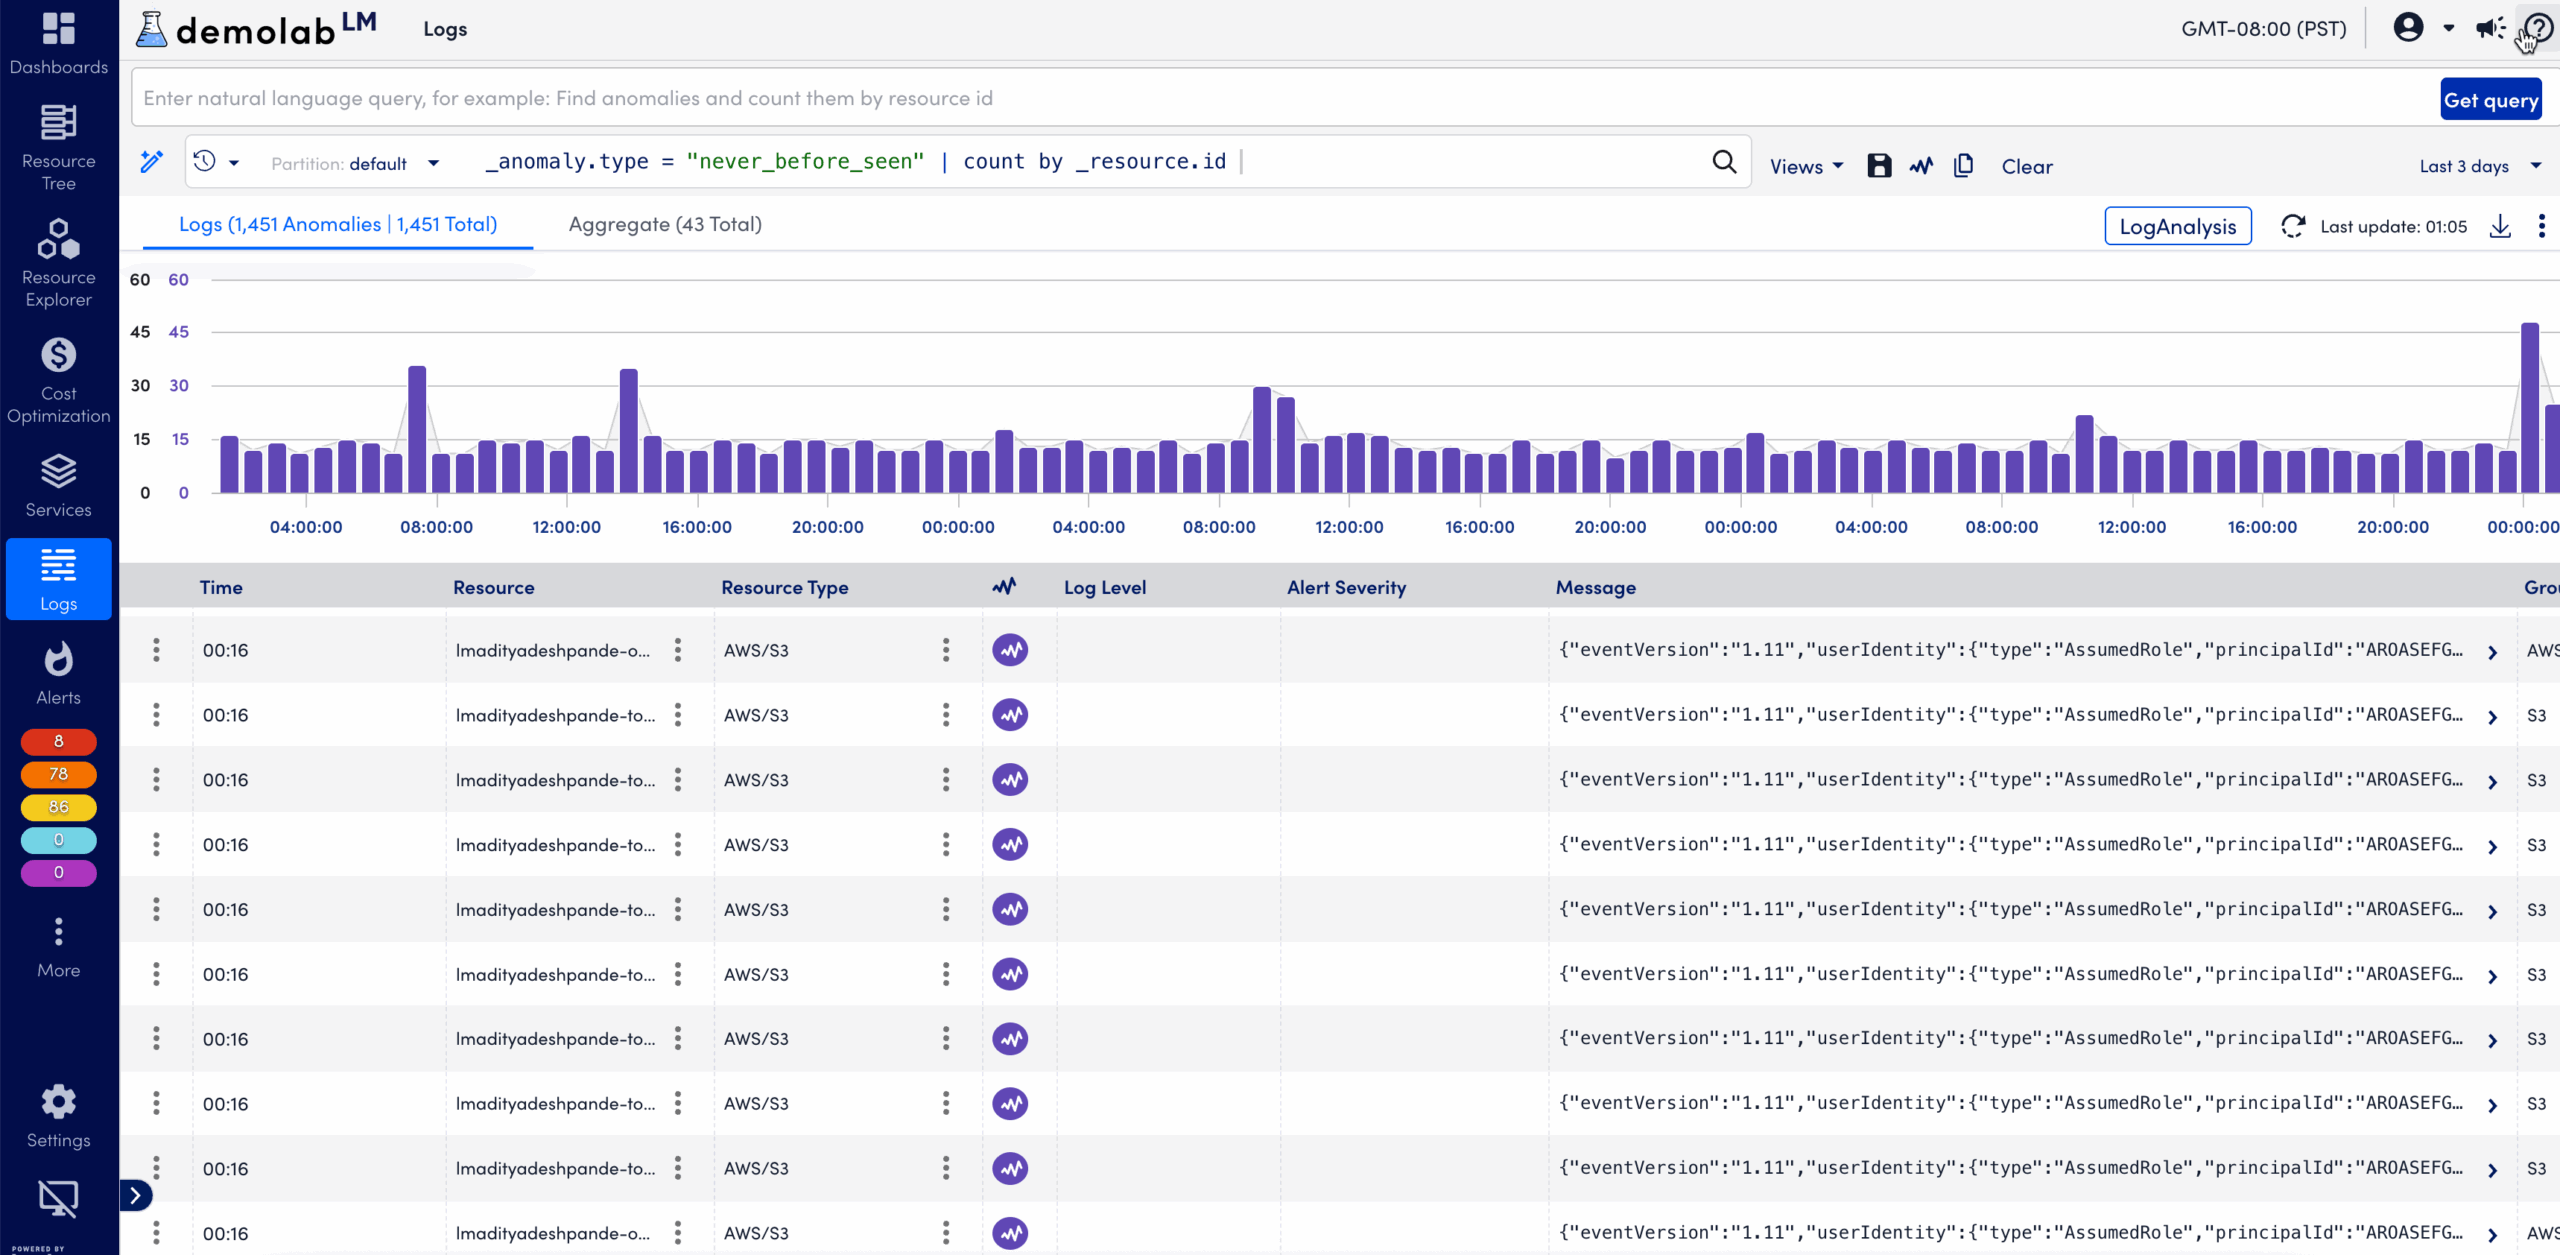
Using the Query Bar
After you enter your query select Run Query to start the search. The query bar includes autocomplete to speed up query creation. When you start typing, the autocomplete menu displays a list of suggested fields, operators, and values based on the data available in your logs.
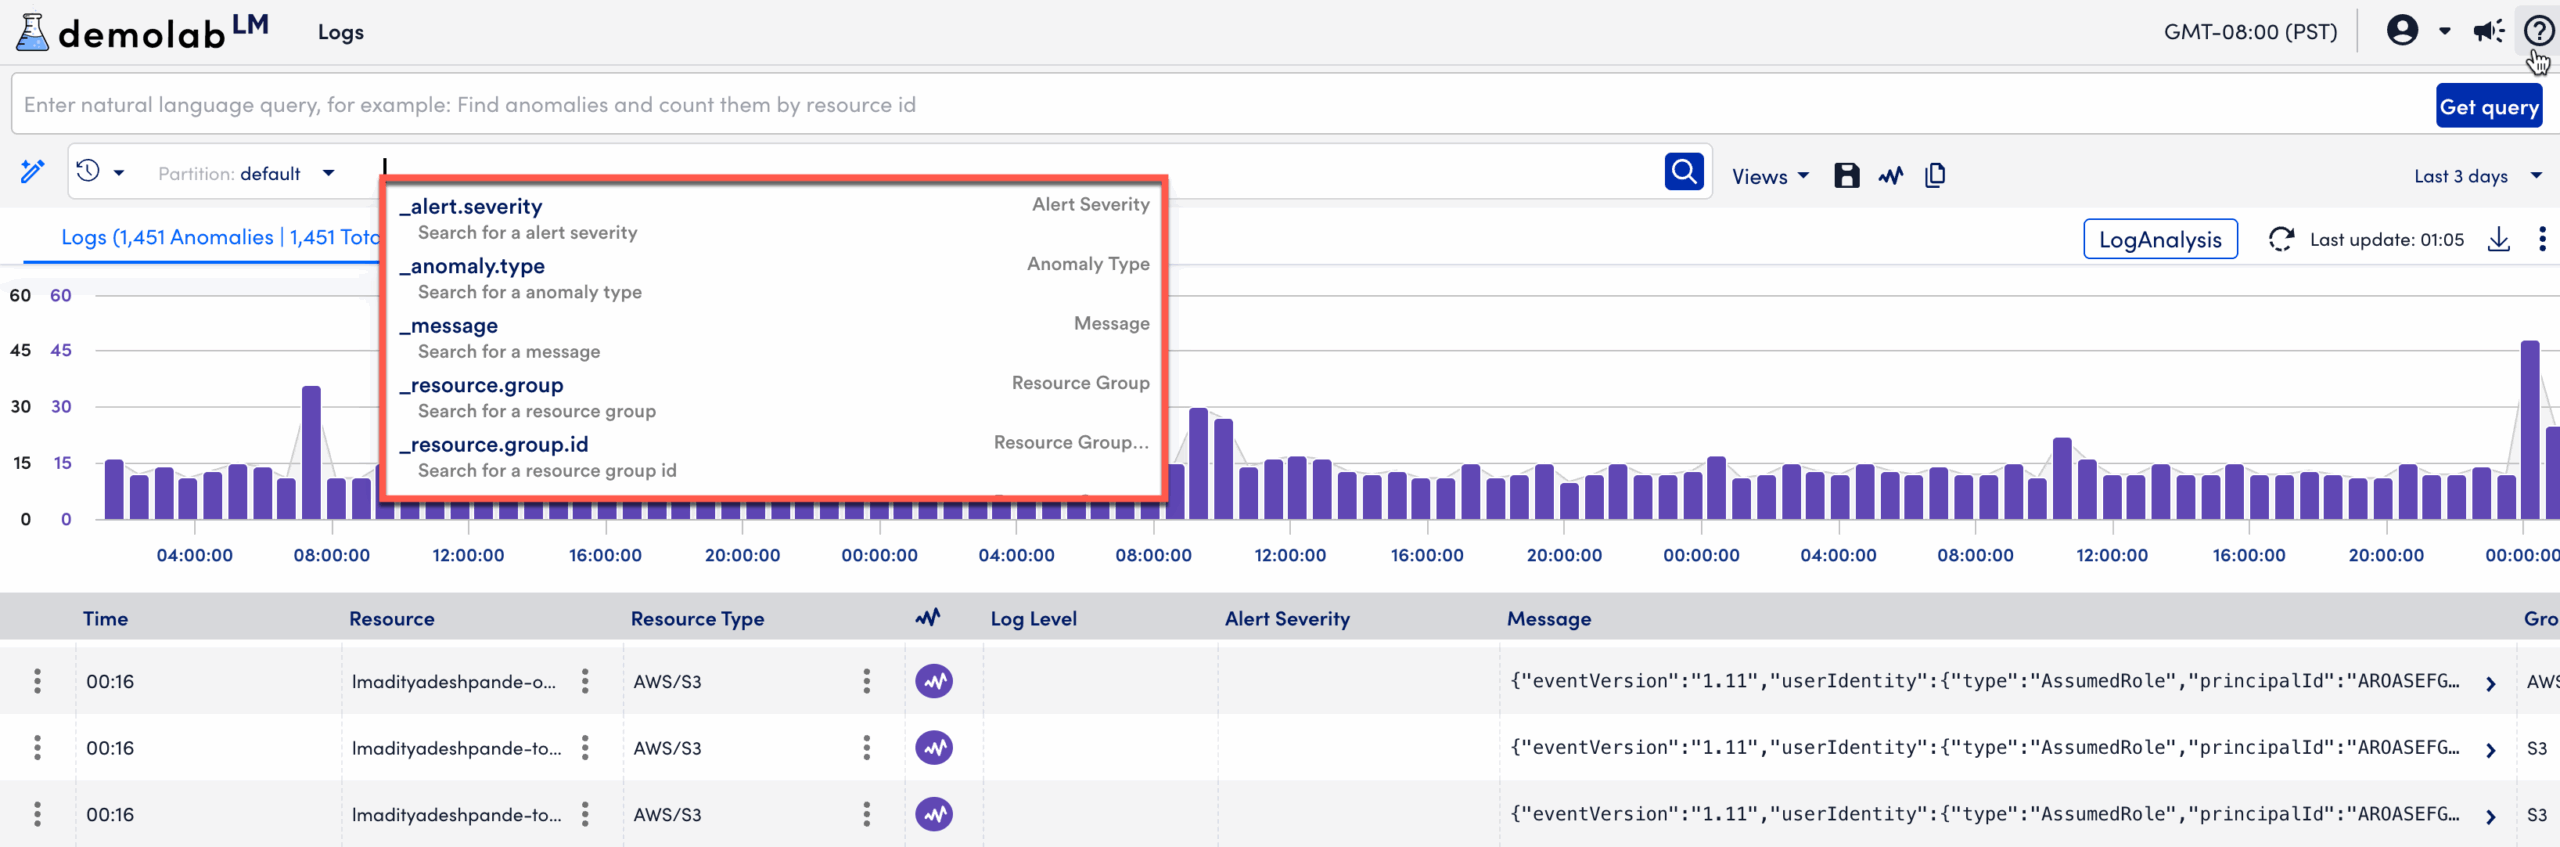
If you select a field from the list or type a field name manually, autocomplete provides value suggestions for that field. After entering a complete keyword or field=value pair, additional options display to help you build complex queries.
For example: Autocomplete can suggest logical operators such as AND, OR, and NOT.
For more information, see Log Search Cheatsheet in the product documentation.
Complex queries covering long time ranges can take additional time to complete. You can stop an active query at any time by selecting Stop Query. This action cancels the running search and improves responsiveness during troubleshooting.
Changing the Time Range
You can define or adjust the time range of your query by selecting a preset or custom range with the time picker, or by dragging within the graph to zoom into a specific period.
You can return to the previous view by selecting Exit graph zoom. The default time range is 5 minutes.
Note: Logs from newly created resource groups may not appear immediately in log totals. Metadata is established during log ingestion and uses the resource groups that existed at that time.
Running the Search
Searches do not execute automatically. When you complete writing your query, you need to run the query.
When you run a search in LM Logs, the platform executes your query against the indexed log data and returns the matching log events within the defined time range.
After the search completes, the Results panel displays all log entries that match your filters, along with associated metadata such as timestamp, severity, resource name, message content, etc.
You can refine the results by modifying your query, adjusting the time range with the time picker, or applying additional filters (for example, severity or resource).
Once the desired data is retrieved, you can perform additional actions such as copying the query syntax, clearing the query, or saving the query for reuse.
Viewing Search History
You can review and manage previous searches from Recent Searches. The menu displays up to 10 queries from your history. You can remove individual queries or clear all entries to reset the list.
Saving a Search
You can save a query as a Saved View to reuse it later. A Saved View stores your filters and time range so you can return to the same log context without rebuilding the query.
Saved queries display in the Log Query Library and can be shared, duplicated, or added to dashboards depending on your Role-Based Access Control configuration.
Copying a Query
After running a search, you can quickly copy the full query syntax from the query bar. This enables you to reuse or share the query for collaboration or integration with other monitoring tools.
Copied queries retain their field structure and filters, ensuring consistency across environments.
Clearing a Query
If you want to start a new search, you can clear the current query to reset the query bar. Clearing query removes all entered syntax and applied filters, returning the Query Bar to a blank state.
