
Service Level Agreement Report
Last updated - 02 February, 2026
The Service Level Agreement (SLA) report shows the percentage of time that one or more datapoint values met or didn’t meet specified SLA thresholds. You can create individual SLA reports for a set of Resources or Websites.
Performance Metrics Calculation
For each individual website or resource included in your SLA report, the baseline calculation is the amount of time the resource or website met its acceptable service levels compared to the amount of time covered by your SLA.
The individual SLA value for a website or resource will be aggregated with the SLA values of other websites or resources monitored by the report when:
- Multiple websites or resources are selected as a single metric.
- The SLA report provides an overall, single SLA summary value for all websites or resources monitored.
The calculation options you can choose from will depend on whether you are measuring performance across websites or resources.
The following table summarizes how SLA performance is measured for websites versus resources, with examples illustrating the impact of each calculation method:
| Feature Area | Calculation Description |
| Websites | The aggregated SLA value is calculated by averaging the percentage of time in which acceptable service levels were maintained by the individual websites. For example, consider that an SLA report is measuring the availability of the following four websites over a one-day period:
|
| Resources | There are two calculation methods available for determining the aggregated SLA value. One of the methods is the one described in the previous section (that is, averaging the percentage of time in which acceptable service levels were maintained by the individual resources). The other calculation method measures the percentage of time in which all resources concurrently met their individual thresholds for acceptable service levels. For example, consider that an SLA report is measuring performance thresholds for the following four resources over a one-day period:
|
Configuring an SLA Report
- In LogicMonitor, navigate to Reports.
- Select
 > Add Report > select Add for the SLA report.
- In the Name field, enter a name for the report.
Report names cannot include the operators and comparison functions used in LogicMonitor’s datapoint expression syntax. - (Optional) In the Description field, enter a description for the report.
For example, you can enter a description of the specific purpose of the report. - From Report Group, select the report group where your report is stored.
Matching groups display as you type, and you can select the group from the list. - From Format, select the type of format for the output of the report.
You can select HTML, PDF, or CSV.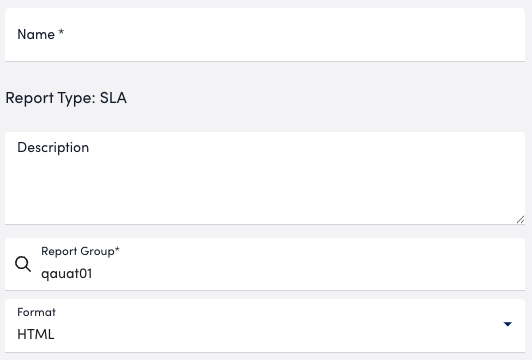
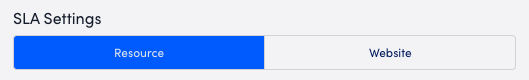
- Select whether to create the SLA report for resources or websites using the SLA Settings.
- In the SLA Period section, define the days and time for which the SLA is effective, by doing the following:
- Select the days that the SLA is effective.
- Configure the time for the selected days by doing one of the following:
- To choose an all day time range, select All Day, and then select the applicable time zone.
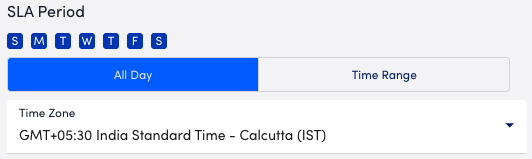
- To configure a time range, select Time Range, and then configure the time range.
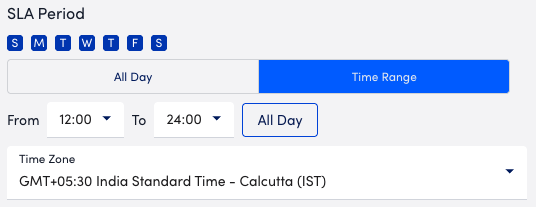
A confirmation displays the number of days the time range is set for.
- To choose an all day time range, select All Day, and then select the applicable time zone.
Note: This setting should represent the time range of your actual SLA and not the time range of the report.
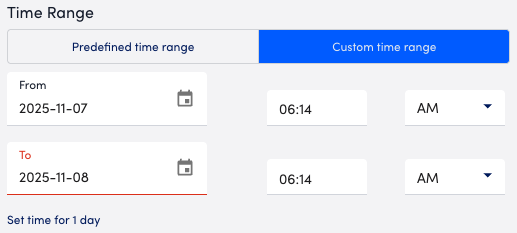
- In the Time Range section, configure the time range you want to base the report on by doing one of the following:
- To configure a predefined time range, select Predefined time range, and then select one of the time range options.
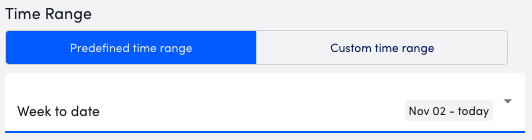
- To configure a custom time range, select Custom time range, and then configure the date and time.
- To configure a predefined time range, select Predefined time range, and then select one of the time range options.
- (Applies to resource SLA only) If you are creating a report based on resources, do the following:
- From the Behavior When No Data Is Collected dropdown menu, select one of the following to define what impact a period of no data has on the SLA calculation:
- To exclude unmonitored time in SLA calculations, select “Ignore (subtract from total possible time)”.
For example, if your report’s time range spans 100 hours, of which there are five hours of missing data, the report will calculate the SLA value based on a total time range of 95 hours. - To consider any unmonitored time as a violation against your SLA, select “Count as violation (subtract from uptime)”.
For example, if your report’s time range spans 100 hours, of which 15 of those hours represent performance that doesn’t meet SLA thresholds and five of those hours represent no data received, the report will calculate SLA violation time as 20 hours, which results in an overall SLA value of 80%. - To consider any unmonitored time as meeting SLA requirements, select “Count as available (add to uptime)”.
For example, if your report’s time range spans 100 hours, of which 15 of those hours represent performance that doesn’t meet SLA thresholds and five of those hours represent no data received, the report will calculate SLA violation time as 15 hours, which results in an SLA value of 85%. - To consider a time delay in the SLA calculation, select “Collector delay with no data”.
If there is a delay in the time a datapoint is received that does not match the defined polling interval, this data is not considered a violation, as long as the datapoint is valid.
- To exclude unmonitored time in SLA calculations, select “Ignore (subtract from total possible time)”.
- From the Calculation Method dropdown menu, select one of the following to define how LogicMonitor aggregates the SLA values among multiple resources:
- To measure the percentage of time in which resources concurrently met their individual thresholds for acceptable service levels, select “Percent all resources available”.
- To average the percentage of time in which acceptable service levels were maintained by the individual resources, select “Average of all SLA Metrics”.
- From the Behavior When No Data Is Collected dropdown menu, select one of the following to define what impact a period of no data has on the SLA calculation:
-
In the SLA Metrics section, configure the datapoints to track for this report based on the corresponding SLA by doing the following:
- Use the Group, Resource, DataSource, Instance, and Datapoint fields in combination to add a single metric.
Multiple metrics can be added, but they must be configured and saved one at a time.Note: If a single metric applies to multiple resources, the report aggregates the SLA value for that metric using the calculation method selected in the Calculation Method field. - Select the applicable operator from the Datapoint SLA Threshold option.
- To remove scheduled downtime from the SLA calculations, configure the Exclude SDT periods setting.
- Use the Group, Resource, DataSource, Instance, and Datapoint fields in combination to add a single metric.
Note: Note: If the exclusion is set at the resource level, then only SDT set at the resource level is excluded from the SLA calculation. Any SDT set at the group level for those resources is not excluded in this case. If the exclusion is set at the group level, then only SDT set at the group level is excluded from the SLA calculation.
- Toggle the Only display Resources with less than 100% availability switch to exclude resources that achieved a 100% SLA value from the report.
This only affects the report’s display, not the calculations. - Toggle the Display SLA Summary (Total %) switch to include an overall, single SLA summary value for all websites or resources monitored in your report.
This summary is calculated using the method selected Calculation Method. - Use the Columns settings to configure the columns you want displayed in your report.
You can configure the order the columns display in and whether or not to hide certain columns.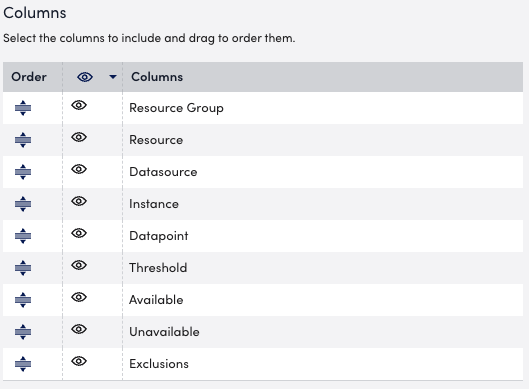
- In the Properties section, select the host properties you want to include in the report.
Each property displays as a column header in your report.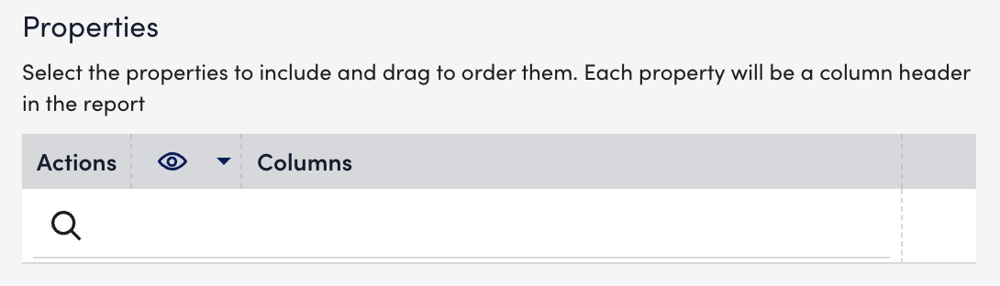
- In the Report Schedule section, do the following to configure the report to generate on a schedule:
- Toggle the Generate this report on a schedule switch.
- From the Frequency dropdown menu, select how frequent you want the report to generate, and then configure when you want the report to generate.
For example, if you configure the report to generate daily, you can choose the time to generate the report each day. If you configure the report to generate weekly, you can choose the day of the week and time to generate the report for the selected date. If you configure the report to generate monthly, you can configure the day of the month and time to generate the report.
Each frequency option provides you a setting for selecting the time zone. - In Recipients Email, enter the name of the user you want to receive the generated report.
You can also add recipient groups.
You can enter as many users as needed.
LogicMonitor attempts to match values as you type.
The recipients you add to the report are emailed a generated report based on the format you configured and the email associated with the username.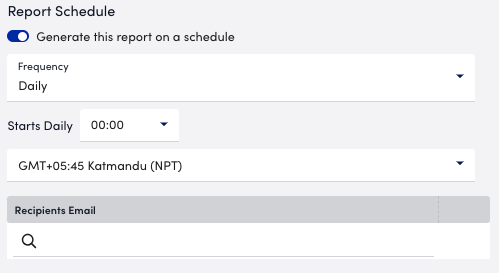
- Do one of the following to save the report:
- Select Save.
The report saves to the Report Group you selected.
If you configured the report to generate on a schedule, the report generates and sends to recipients based on the frequency you configured. - Select Save and Run.
The report saves to the Report Group you selected and generates a report based on the format you configured.
If you configured the report to generate on a schedule, the report generates and sends to recipients based on the frequency you configured.
- Select Save.
Threshold Limits
Note: For ad-hoc reports, you must select the maximum date range as less than or equal to last month. If you require a date range more than the previous month, you must schedule the required reports.
Adhoc Requests Thresholds (Limit for number of instances)
| CSV | HTML | |
| 2600 | 500 | 500 |
Scheduled Requests Thresholds
| CSV | HTML | |
| 16700 | 5000 | 5000 |
