
Dashboards Overview
Last updated - 12 December, 2025
Dashboards enable you to build a customized, strategic view of your systems, presented in a way that is most relevant to you and your business. Dashboards can serve a variety of functions and are most commonly used to provide the following:
- An at-a-glance view of infrastructure performance
- A comprehensive view of application status
- Centralized metrics for cloud, hybrid, and virtualized infrastructures
- An overview of high-level business metrics and performance for executives
- Targeted infrastructure insights for internal and external customers
- A scratchpad of pinned instance widgets for root cause analysis
Common Dashboard Types
The uses for dashboards can be as varied as the types of resources monitored in LogicMonitor, but there are some common types across accounts. These include the following:
| Dashboard Type | Use Case |
| Business/Executive metrics | An overview of metrics related to business success |
| Resource dashboard | Widgets and graphs related to a specific resource type |
| Network dashboard | Collection of top ten graphs, performance overview, and status of network resources |
| NOC overview | Status resource groups, resources, and applications per location |
| Virtualization | Performance metrics and alert status of virtual machines |
Dashboard Display
After you create a dashboard, select from a variety of widgets to build out the dashboard’s display. For more information, see Dashboard Creation and Widget Creation.
Note: LogicMonitor provides a soft limit of 100 widgets per dashboard. For more information, see Limits, Quotas, and Constraints.
Overview and instance graphs can also be added to a dashboard directly from the Resources page. For more information, see Graphs Tab.
You can also view data forecast graphs and anomaly detection. For more information, see Data Forecast Visualization and Anomaly Detection Visualization.
Dashboards can be the following:
- Viewed within the LogicMonitor account by users with a view or manage permission
- Displayed on an auto-rotate cycle (slide show)
- Shared as a read-only web page. For more information, see Sharing Dashboards via Email.
Private Dashboards
Private dashboards make great testing grounds for investigating on-the-fly issues or testing new widgets. The ability to create private dashboards is governed by a user’s assigned roles.
Note: Dashboards that are intended to be viewed by more than one user should remain public dashboards.
A user’s assigned role determines whether public dashboards are available to that user for viewing and management.
Users with roles that include “view” or “update” permissions to Dashboards can access, create, and edit private dashboards for all users. This access also supports troubleshooting and overall dashboard management.
Dashboard Toolbar Options
Get to know the following different toolbar options: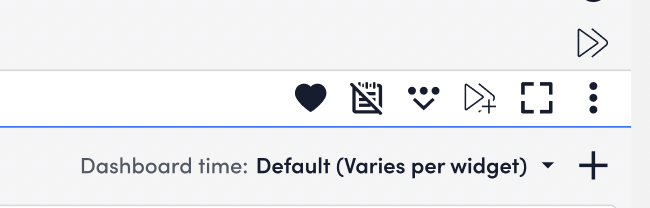
| Toolbar Option | Description |
| Manage | Ops Notes enables you to add time stamped annotations to your dashboard’s graphs in order to identify correlations between performance events or to demarcate historical events such as upgrades. You can also filter for visible ops notes. |
| Ops Notes | Dashboard sharing enables you to send a snapshot view of your dashboards to colleagues or customers via email as a linked webpage. This is particularly useful for generating a visual report of your infrastructure’s overall status. For more information, see Sharing Dashboards via Email. |
| Share | Dashboard sharing allows you to send a snapshot-view of your dashboards to colleagues or customers via email as a linked webpage. This is particularly useful for generating a visual report of your infrastructure’s overall status. For more information, see Sharing Dashboards via Email. |
| Favorites | Favoriting a dashboard will save it to the Favorites group in your dashboard navigation panel. This will centralize your most frequently viewed dashboards in one location. For more information, see Adding a Dashboard or Dashboard Groups to Favorites. |
| Clone | Cloning a dashboard will replicate its configuration and apply it to a new set of resources using tokens. For more information, see Dashboard Tokens. |
| Add Widget | Add a widget to your dashboard to set up your dashboard display. For more information, see Widget Creation. |
| Add New Dashboard | Create a new dashboard. For more information, see Dashboard Creation. |
| Add Dashboard Group | Create a dashboard group. Recommendation: Organize dashboards based on shared attributes, such as displaying content related to a specific datacenter or office location, end user, and so on. |
| Faux Full Screen Mode | Most browsers will force you to exit full screen mode for 24 hours, meaning you have to adjust your full screen display at least once each day. To avoid this, LogicMonitor uses a Faux full screen view, which hides the left navigation panel and gives you the option to hide your dashboard titles and top navigation panel. |
| Slideshow | View some or all of your dashboards on a rotating basis to keep an eye on your entire infrastructure’s health and performance at-a-glance. For more information, see Setting up a Dashboard Slideshow. |
| Export | Export dashboards to other LogicMonitor users within your organization or to external users for a snapshot of dashboard data. For more information, see Exporting Dashboards and Dashboard Groups. |
| Delete | Delete dashboards you no longer need to keep your dashboards list current. For more information, see Deleting a Dashboard. |
| Time Range | Set all dashboard widgets to show data for a specific time range. If Default (varies per widget) is selected, then the time frame will be dependent on the individual widgets and not the dashboard. |
| Toggle Graph Legends | Widget legends are collapsed by default. To view legends, select the Expand All option from the top navigation or select the three dots at the bottom of the widget. When expanded, legend details will layer if they exceed the allowed space. To allow more space, resize the widget to make it larger. For more information, see Resizing Widgets. When the widget is the right size the min, max, and average data will display. |
Note: The exact match filter like (HTTP-|HTTPS-|Port-|Ping) is not supported for refining the query. You can either manually select the options from the drop-down list or use a glob expression ((172*|192*))*. For more information, see Using Glob Expressions Throughout the LogicMonitor Portal.
Dashboard Tokens
Dashboard tokens enable you to apply a single dashboard template to different resource or website groups simply by changing the tokens’ values. This is particularly useful for companies who’d like to clone a common dashboard setup across multiple end users or datacenter/office locations. Set up default or custom dashboard tokens to pull data into your dashboard widgets. For more information, see Tokens in Widgets.
Recommendation: Avoid the inclusion of confidential information, such as secret keys or sensitive values (like passwords) as part of the token when configuring dashboards or widgets. Since dashboards can be shared, exported, or viewed by others, using confidential data in tokens increases the risk of unintended disclosure.
Default Tokens
LogicMonitor provides the following tokens that display as suggested results:
- ##defaultResourceGroup##: All widgets added to this dashboard default to pulling data from the resource group specified as this token’s value.
For example, a managed services provider (MSP) has organized each customer’s resources in their own resource groups titled “CustomerA_Resources,” “Customer B_Resources,” and so on. To create a dashboard that reflects only the performance of customer A’s environment, this token’s value would be set to resource group “CustomerA_Resources.” - ##defaultWebsiteGroup##: All widgets added tot his dashboard will default to pulling data from the website group specified as this token’s value. Using the previous example, to display only customer A’s website data, this token value would be set to website group “Customer A_Website.”
Note: After you save a new dashboard with one or both of these default tokens, navigate back to the dashboard’s settings to select the Overwrite existing Resource Group field with ##defaultResourceGroup# or ##defaultWebsiteGroup## tokens option. This automatically replaces any pre-existing values set in your widget definitions with these default tokens. This is useful for creating templates of pre-existing dashboards to use repeatedly across customers, datacenter locations, and more.
Custom Tokens
Unlike default tokens, the value for custom tokens is not a lookup field, but rather a text input that can be any string. The primary use case for custom tokens is to facilitate the input of new customer data after cloning a dashboard.
Continuing with the example in Default Tokens, the MSP has cloned customer A’s dashboard for use with customer B. On this dashboard, there is a table widget that displays the remaining CPU for one of the customer A’s servers. If the MSP used a standardized naming strategy for all their resources (for example, CustomerName.Server), they could simply add a custom token to their dashboard (For example, ##CustomerName##) and define the value as the name of the customer to which this dashboard is dedicated (in this case, customer A). In the table widget’s Resource Display Name field, they would use ##CustomerName##.server. After cloning the dashboard for customer B, the MSP can populate their data by replacing the value of ##CustomerName## with the name of customer B in the Manage Dashboard dialog box.
