
Log Query Tracking
Last updated – 07 April, 2026
Log Query Tracking enables you to automatically collect and monitor time-series metrics from your saved log queries.
When tracking is enabled, LogicMonitor runs your saved query every five minutes and captures the resulting metrics as datapoints. These datapoints are stored within a dedicated DataSource instance that LogicMonitor creates for you in a Log Tracked Queries resource group. From there, they are seamlessly displayed in graphs and dashboards, giving you real-time visibility into your system’s performance.
By using query tracking, you can gain ongoing insights into log patterns, such as login failures, error frequency, or traffic volume trends.
Note: Tracking is only available for saved queries. You must first create and save a query before you can enable tracking.
Basic and Aggregate Queries
Understanding the difference between basic, simple aggregate, and complex aggregate queries is essential when designing tracked queries in LogicMonitor. Query classification is determined by the operations performed, not by syntax alone.
Tracked queries can generate either simple or aggregate datapoints, depending on the structure of your queries.
The following are the examples of datapoint names for the simple and aggregate query:
- Query:
* | avg(_size) as average, sum(_size) as sum, max(_size) as maximum - Datapoints:
average,sum,maximum
The following table provides examples of each query types:
| Query Type | Description | Query Example |
| Basic Query | A basic query evaluates individual log or metric records without calculating summary values across multiple records. These queries do not use aggregate functions such as count, avg, sum, min, max, or group by. | _message ~ “Login Failure” | parse /Method:(?<method>\w+)/ as method |
| Simple Aggregate Query | A simple aggregate query calculates summary values across all matching records without grouping results into multiple dimensions. These queries use aggregate functions but do not include a group by clause that creates multiple result sets. | _message ~ “Login Failure” | count,avg(_size),max(_size) |
| Complex Aggregate Query | A complex aggregate query calculates summary values and groups results by one or more fields. These queries typically include parsing or transformation steps followed by aggregate functions combined with a group by clause, which can generate multiple instances per polling interval. | “StatusCode” | parse /StatusCode:(?<statusCode>\d+)/ as statusCode | parse /Latency:(?<latency>\d+)ms/ as latency | parse /Method:(?<method>\w+)/ as method | avg(latency) as avg_latency_ms, count by statusCode, method |
| Additional Example of Complex Aggregate Query | The example demonstrates a complex aggregate query that groups results across multiple resource attributes and performs additional calculations on aggregated values, such as unit conversion and derived averages. | _resource.type=”Database” | count(_size), sum(_size) by system.tenant.identifier, _resource.vendor, _resource.name | num(_sum/1000000000) as GB | num(_sum/_count) as avg_size | sort by GB desc |
Each query type produces dynamic datapoints that are stored in the corresponding tracked query instance. In addition, you can disable or delete tracked queries at any time if you no longer need to collect metrics.
Query Tracking Limits
LogicMonitor enforces query tracking limits to maintain predictable performance and consistent resource utilization across customer portals. These limits differ based on whether a query is non-aggregate or aggregate.
The LogicMonitor portal supports a maximum of 300 tracked queries per company, distributed as follows:
Non-aggregate queries
- One shared DataSource
- Up to 250 instances, where each instance represents one tracked query
Aggregate queries
- Up to 50 DataSources, with one DataSource per aggregate query
- Each aggregate DataSource supports:
- A maximum of 50 total instances
- Up to 10 group-by results per polling interval
- A maximum of 10 new instances created per poll, capped at 50 instances per DataSource
- 250 non-aggregate queries
- 50 aggregate queries
Note: LogicMonitor may create up to 10 instances per polling interval for advanced aggregate queries.
An instance is a single grouped result returned by an aggregate query during a polling interval. For example, a query grouped by statusCode and method creates one instance for each unique statusCode–method combination returned per poll.
These limits ensure that performance and resource utilization remain consistent when large numbers of queries are being tracked.
Each tracked query runs as a scheduled task within LogicMonitor’s DataSource framework, so these limits apply across your account’s total tracked queries.
Requirements for Tracking a Log Query
To create or manage a tracked query, you need the following:
- You must have LM Logs licensing enabled for your account.
- You must have Logs “View” permission.
- You must have read access to at least one device or deviceless log.
- The query must be saved before enabling tracking.
- The query must return at least one groupable field for metrics to be collected.
- Query tracking must be enabled for your account. For access, contact your Customer Success Manager.
- Tracked query names must meet the following criteria:
- Contain 50 characters or fewer.
- Include only alphanumeric characters, colons (:), periods (.), and underscores (_), with an optional hyphen (-) at the end.
- Contain no whitespace.
Tracking a Saved Log Query
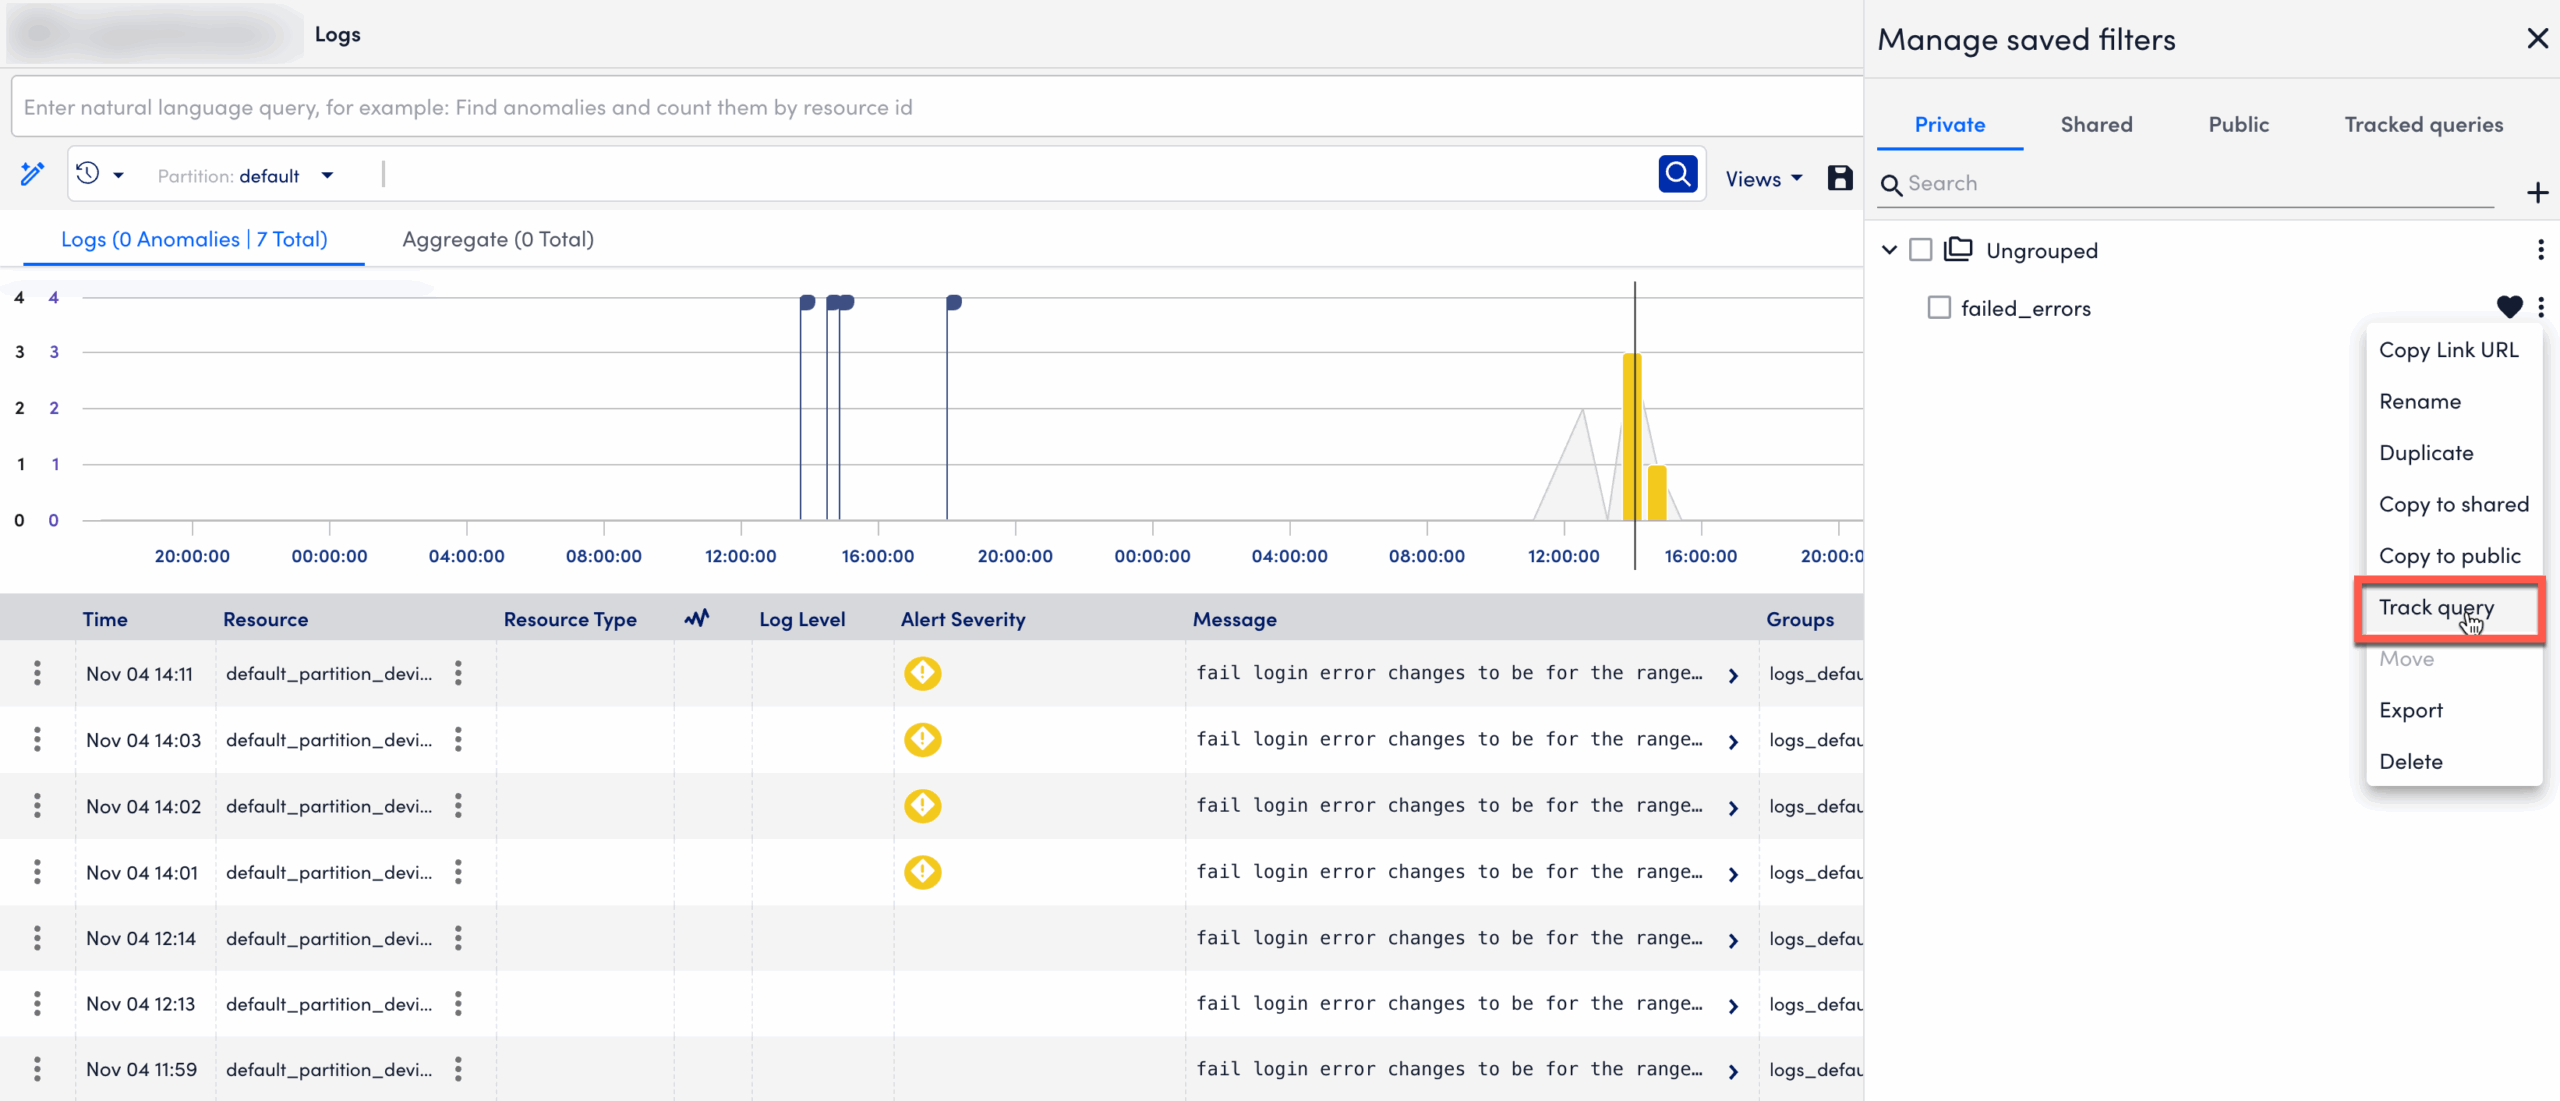
- In LogicMonitor, navigate to Logs.
- Select the Views dropdown and then select Manage Saved Filters.
- In the panel, locate the saved query you want to track.
- Select
 More options.
 - Select Track query.
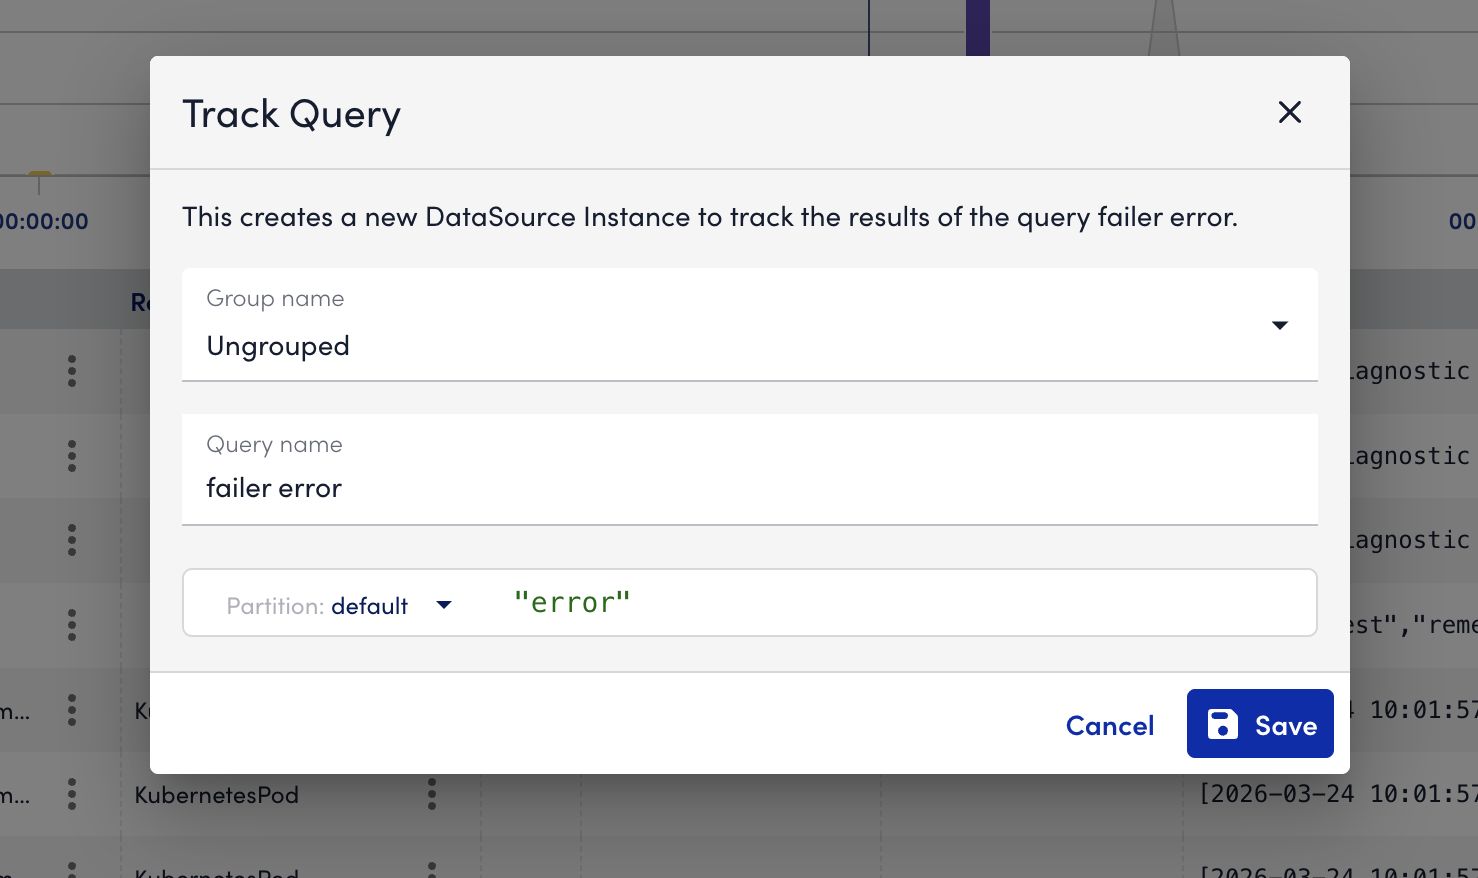
- In the Track Query modal, do the following:
- Select the Group name where you want to add the tracked query.
- Review or update the Query name.
- Confirm or modify the query expression.
Note: When tracking a query, only groups that you create and that are listed in the Tracked Query tab display in the Group name field of the Track Query dialog box.
- Select Save to create the tracked query.
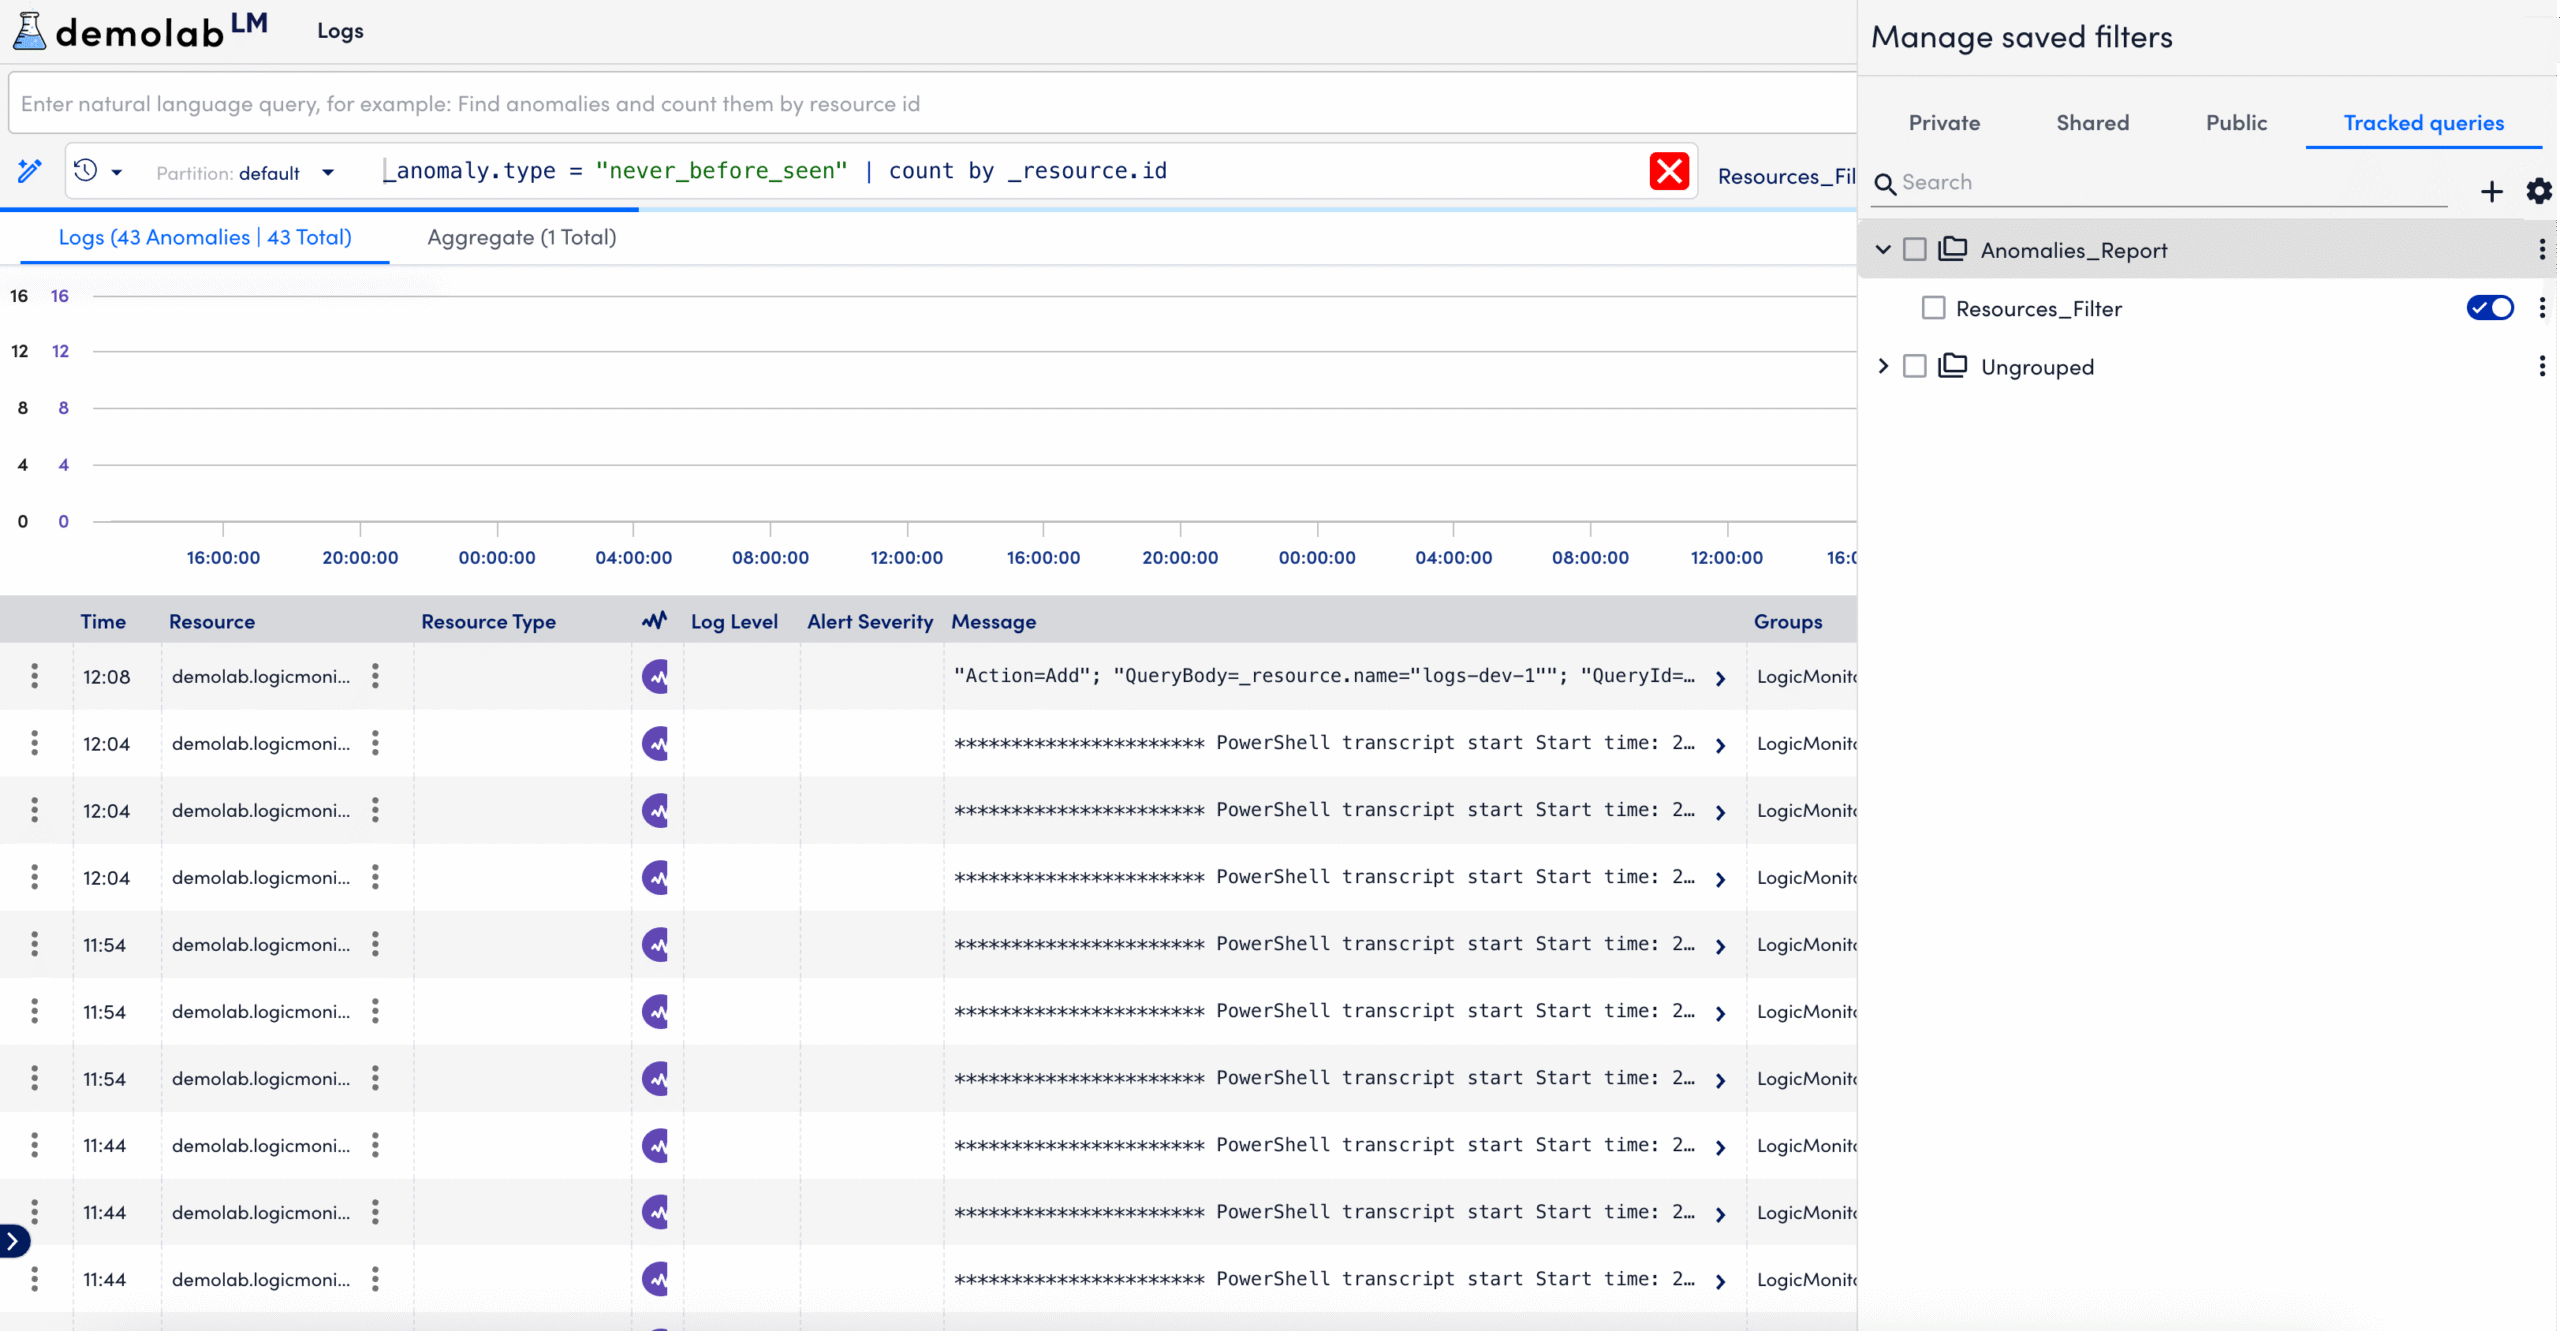
Your tracked query is saved under the Tracked queries tab.
Managing Tracked Queries
You can perform various actions on tracked queries after they are added to the tracked query library.
Adding a New Tracked Query Group
You can add a new group to the tracked query library to organize tracked queries.
- In LogicMonitor, navigate to Logs.
- Select the Views dropdown menu, then select Manage Saved Filters.
- Select the Tracked queries tab.
- In the tracked query library, select
 Add new Group to organize tracked queries.
 - In the Add new Group modal, enter an appropriate Group name and Description.

- Select Save.
The newly added group displays in the tracked query library.
Starting and Stopping Query Tracking
You can start or stop tracking for a query to control whether LogicMonitor collects metrics from it.
When tracking is enabled, LogicMonitor runs the query on a schedule and creates or updates instances based on the query results. When tracking is disabled, the query no longer runs.
To start or stop query tracking, do the following:
- In LogicMonitor, navigate to Logs.
- Select the Views dropdown, then select Manage Saved Filters.
- Select the Tracked queries tab.
- Locate the tracked query in the Tracked queries panel.
- Toggle the Query tracking switch on or off.
LogicMonitor starts or stops running the query based on the toggle state and updates tracked query instances accordingly.
Copying a Tracked Query
You can copy a tracked query to quickly create a new query with the same query definition.
Copying a tracked query does not copy the tracking state. The copied query is saved as a new query and can be tracked independently.
To copy a tracked query, do the following:
- In LogicMonitor, navigate to Logs.
- Locate the tracked query in the Manage Saved Filters panel.
- Select the Tracked queries tab.
- Locate the tracked query you want to copy from the Tracked queries panel.
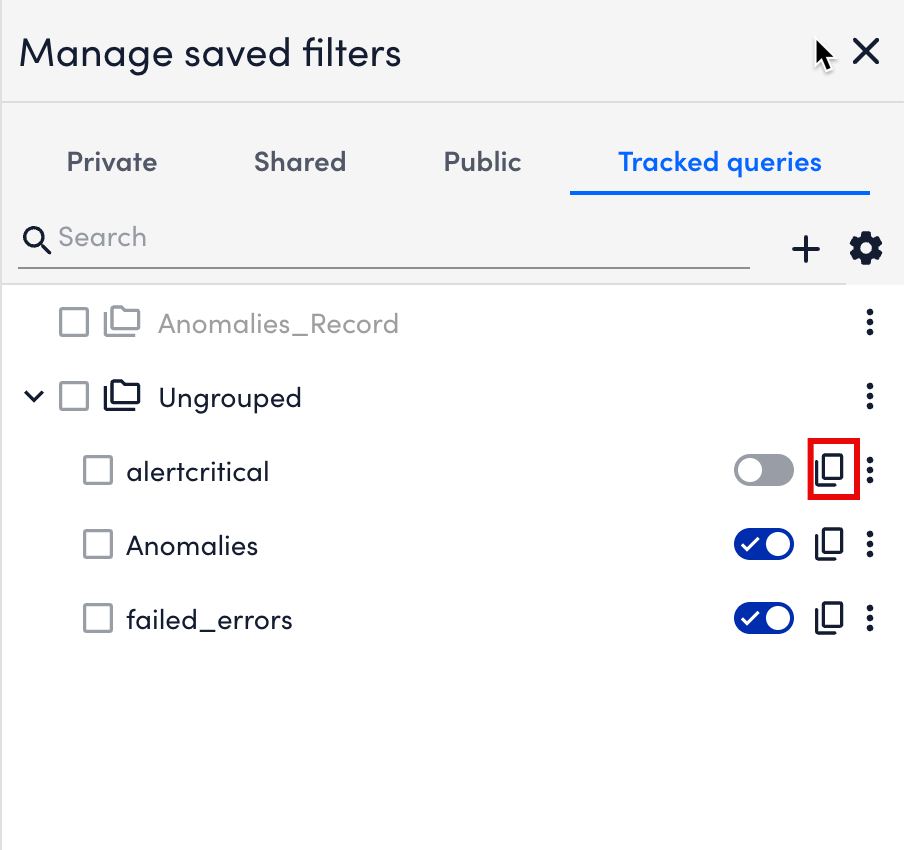
- Select
 Copy.
Copy.
LogicMonitor clones the tracked query.
Copying a Tracked Query Link
You can copy a direct link to a tracked query to share it with other users.
To copy a tracked query link, do the following:
- In LogicMonitor, navigate to Logs.
- Locate the tracked query in the Manage Saved Filters panel.
- Select the Tracked queries tab.
- Select
 More options.
 - Select Copy Link URL.
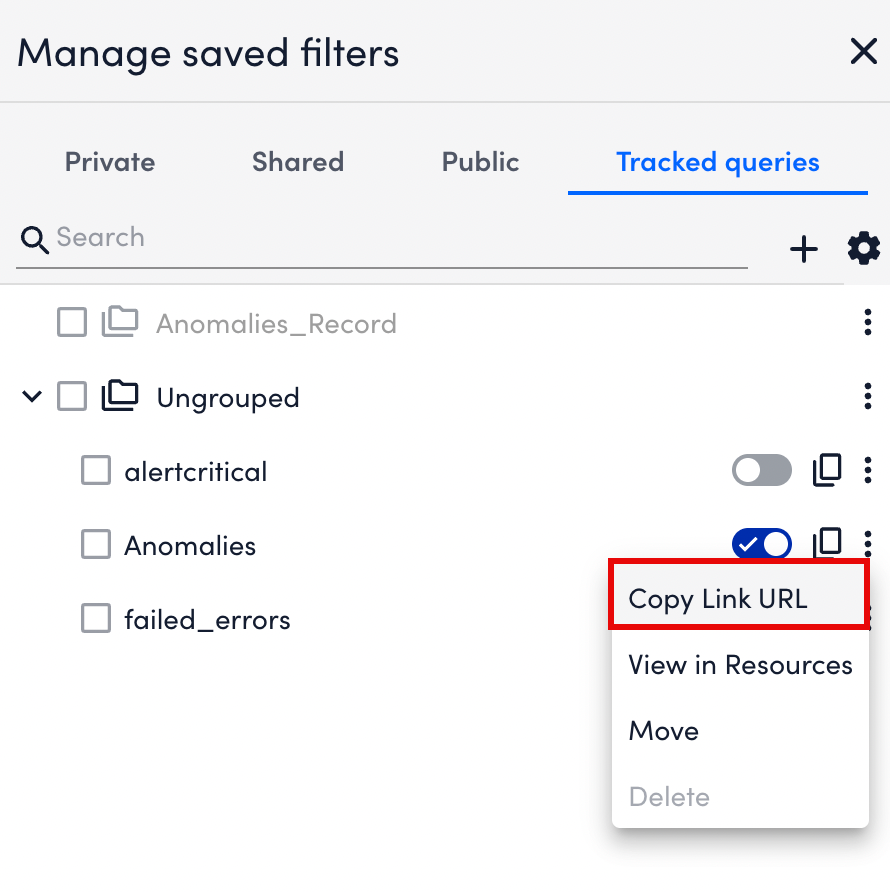
LogicMonitor copies a direct URL to the tracked query, which you can share with other users who have appropriate permissions.
Viewing a Tracked Query in Resources
You can view the instances and metrics generated by a tracked query in the Resources area.
This option helps you understand how the query is represented as monitored data.
To view a tracked query in Resources, do the following:
- In LogicMonitor, navigate to Logs.
- Locate the tracked query in the Manage Saved Filters panel.
- Select the Tracked queries tab.
- Select More options.
- Select View in Resources.
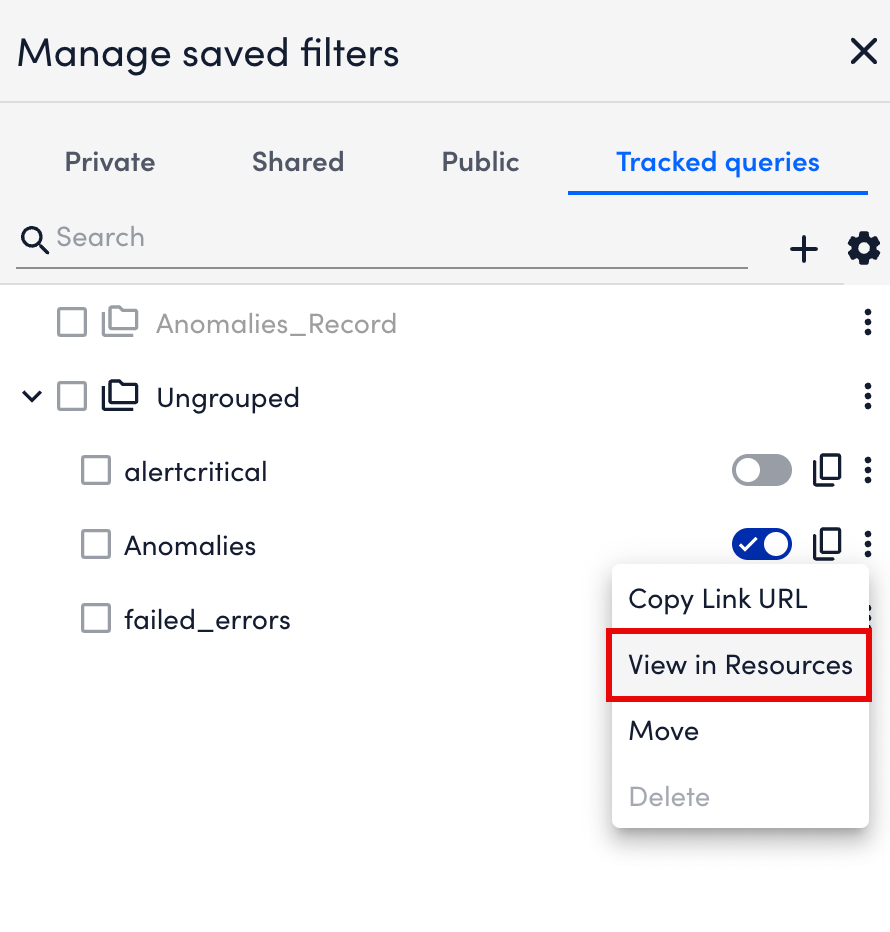
LogicMonitor displays the tracked query instance and its generated metrics on the Resources page.
Note: If you do not have permissions, you will not be able to access this option.
Moving Tracked Queries to a Different Group
You can move a tracked query to a different group to organize tracked queries more effectively.
To move a tracked query to a different group, do the following:
- In LogicMonitor, navigate to Logs.
- Locate the tracked query in the Manage Saved Filters panel.
- Select the Tracked queries tab.
- Select More options.
- Select Move.
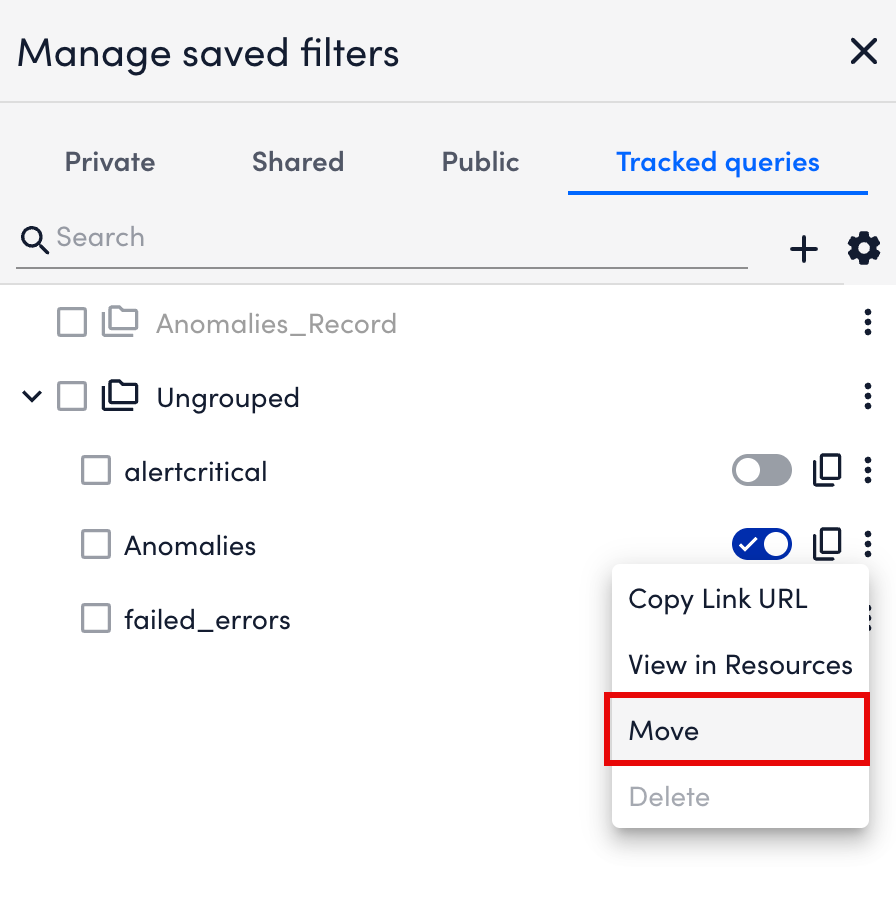
- In the Move to exisiting group modal and select the destination group.
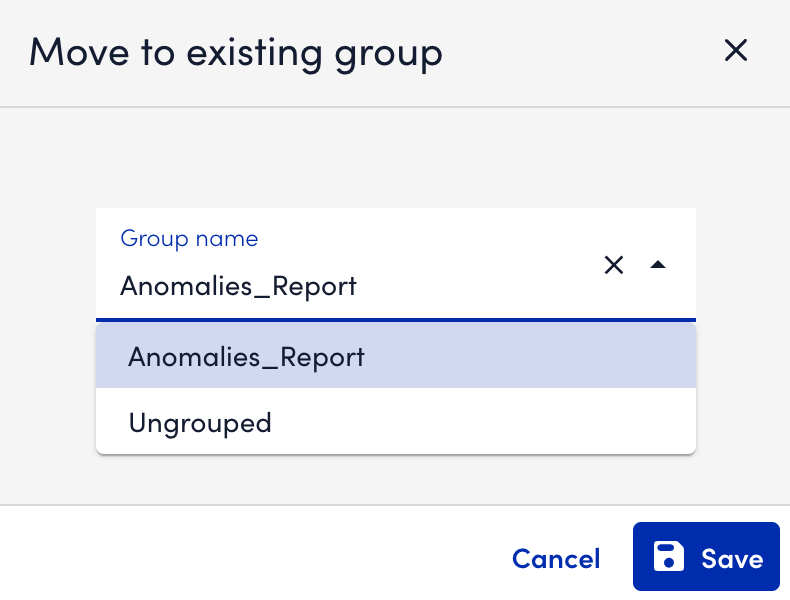
- Select Save.
LogicMonitor moves the tracked query to the selected group and updates its location in the tracked query library.
Disabling Tracking for a Saved Query
You can disable tracking if you no longer want LogicMonitor to collect metrics from a saved query.
When tracking is disabled, the query no longer runs on schedule. Existing data remains available for a limited time unless its instance is removed from the Log Tracked Queries group. If tracking is re-enabled, LogicMonitor resumes data collection on the existing instance or creates a new one.
To disable tracking, do the following:
- In LogicMonitor, navigate to Logs.
- Locate the tracked query in the Manage Saved Filters panel.

- Switch off the Stop query tracking toggle.
- In the dialog box, select Stop tracking.
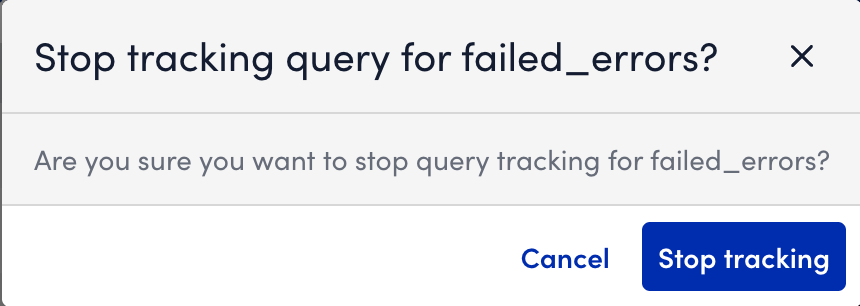
LogicMonitor stops scheduled execution of the query and halts metric collection while retaining existing data for a limited time.
Note: If you re-enable tracking later, a new DataSource instance may be created, or the existing one is updated depending on availability.
Deleting a Saved Query
Deleting a saved query permanently removes it and any associated schedule.
When you delete a tracked query, LogicMonitor stops running the query and automatically deletes the corresponding tracked query instance. This means no new data is collected, and the associated DataSource instance is removed from the Tracked Queries group. If a user account is deleted, any saved queries owned by that user are also removed.
To delete a saved query, do the following:
- In LogicMonitor, navigate to Logs.
- Select the Views dropdown and then Manage Saved Filters.
- Locate the saved query you want to delete.
- Select the More options next to the query.

- Select Delete and confirm deletion.
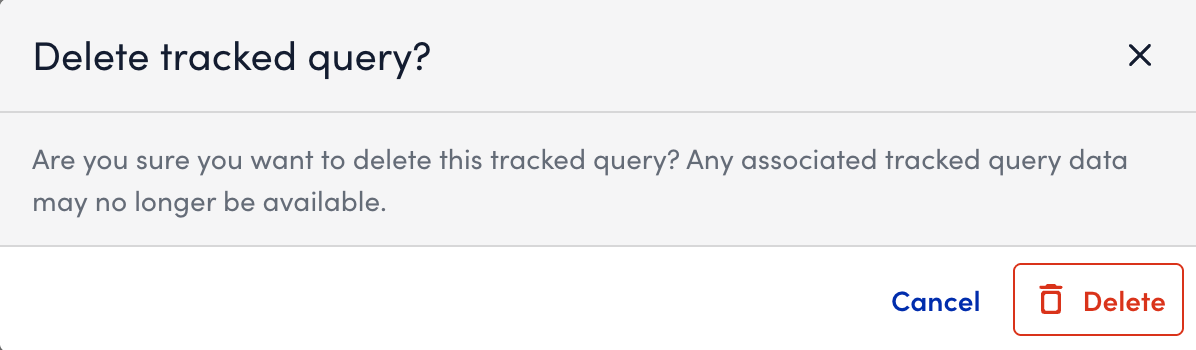
LogicMonitor permanently removes the saved query and deletes its associated tracked query instance.
Note: Only the disabled queries can be deleted.
