LogicMonitor seeks to disrupt AI landscape with $800M strategic investment at $2.4B valuation to revolutionize data centers.

Learn More

Tuning Static Thresholds for Datapoints

Last updated on 04 September, 2024

Receiving too many meaningless LogicMonitor alert notifications can ultimately lead to people ignoring important alerts. On the other hand, not receiving a key alert could result in service downtime or even an outage. One of the keys to avoiding both of these undesirable situations is to tune static datapoint thresholds for your unique environment.

Datapoints, as defined by DataSources, aren’t the only originators of alerts (e.g. alerts can be raised by monitored websites, EventSources, etc. as discussed in What does LogicMonitor alert on?), but they are the most common alert triggers and, therefore, making necessary adjustments can go a long way toward reducing unwanted alert noise.

datapoint threshold options
A static datapoint threshold consists of a timeframe; comparison method and operator; and up to three threshold values for triggering different alert severity levels.

When developing DataSources, LogicMonitor does much of the work for you by setting default static datapoint thresholds based on published documentation and KPIs, industry best practices, research, years of experience, and customer feedback. This means that, for the majority of resources you monitor via LogicMonitor’s DataSources, alerts are triggered right out of the box and are generally meaningful.

However, it is impossible for LogicMonitor to set datapoint thresholds that suit every use case. To ensure that your alerting implementation is sufficient, without being noisy, you can continuously refine the default datapoint thresholds for the DataSources you are using.

LogicMonitor also supports dynamic thresholds for datapoints (as compared to the manually assigned static thresholds referenced throughout this article). Dynamic thresholds are calculated by algorithms and automatically trigger alerts when datapoint values are deemed anomalous (that is, when values fall outside of the expected range based on historical datapoint history). Depending upon your use case, enabling dynamic thresholds instead of (or in addition to) static thresholds can be an excellent alerting strategy. See Enabling Dynamic Thresholds for Datapoints.

Other datapoint settings (in addition to static and dynamic thresholds) that can impact alert noise include:

  • Alert trigger intervals, for example how many consecutive polling cycles a threshold must be exceeded in order for an alert to trigger).
  • Alert clear intervals, for example how many consecutive polling cycles datapoint values must remain below threshold before an alert clears).
  • No Data alert behavior, for example should the absence of expected data trigger an alert?

As discussed in Datapoint Overview, these settings are configured from the global DataSource definition.

Determining the Level at Which Static Datapoint Thresholds Should Be Adjusted

Before you adjust datapoint thresholds, it’s important to first determine at which level they should be adjusted:

  • Global DataSource definition level–Thresholds adjusted at the global level cascade down to every instance (across all resources) to which the DataSource is applied.
  • Resource group level–Thresholds adjusted at the resource group level cascade down to all instances for all resources in the resource group (and its subgroups).
  • Resource DataSource level–If the instances and their parent instance groups do not have their own defined thresholds, then they inherit the threshold set at their resource datasource level. The threshold is applicable only to multi instance resource datasource.
    Note: You can create, update, and delete thresholds only on the LogicMonitor new UI. The LogicMonitor old UI allows you to only view the thresholds.
  • Instance group level–If the instances do not have their own defined thresholds, then they inherit the threshold set at their instance group level.
  • Instance level–Thresholds adjusted at the instance level can be configured to apply to a single instance on a single resource, multiple instances on a single resource, or all instances on a single resource.

For example, if you want the adjusted thresholds to apply to all relevant resources in your network infrastructure (i.e. every single instance to which the DataSource could possibly be applied), you would adjust the thresholds at the global level—in the DataSource definition itself. Global tuning is recommended when a majority of the instances in your infrastructure will benefit from the tuning. Alternately, if the adjusted thresholds are only applicable to a single instance of a single resource, you would adjust the thresholds at the instance level.

Static datapoint thresholds cascade down from the global level. However, if alternate threshold configurations are encountered at deeper levels in the Resources tree, those deeper configurations will override those found at a higher level. For example, thresholds set at the instance level will completely override those set at the resource group and global level, and those set at the group level override those set at the global level.

The following table illustrates the set of threshold configurations that are used when evaluating a datapoint. When interpreting the table, assume the following conditions:

  • The datapoint being evaluated belongs to DataSource F
  • The datapoint being evaluated resides in Instance A
  • Instance A resides in a resource that is a member of Resource Groups D and E
  • Resource groups D and E are siblings on the Resources tree. The Resource Group D was created first followed by the Resource Group E
  • Instance A resides in the Instance Group B
  • DataSource F is applied on a resource and is mapped with Resource Datasource C
Threshold Configurations Present Across Various LevelsConfigurations that Take Precedence for the Datapoint on Instance A
Instance AInstance Group BResource DataSource CResource Group DResource Group EDataSource F
NoNoNoNoNoYesThe configurations set for the global DataSource F definition is inherited and applied.
NoNoNoNoYesYesThe configurations set for the Resource Group E is inherited and applied.
NoNoNoYesNoYesThe configurations set for the Resource Group D is inherited and applied.
NoNoNoYesYesYesThe configurations set for the Resource Group D is inherited and applied. (When a resource belongs to two sibling resource groups, the configurations of the resource group that was created first, in this case the Resource Group D, take precedence.)
NoNoYesYesNoYesThe configurations set for the Resource DataSource C is inherited and applied.
NoYesYesNoYesYesThe configurations set for the Instance Group B is inherited and applied.
YesYesYesYesYesYesThe configurations set for the Instance A is applied.

Tuning at the Global Level

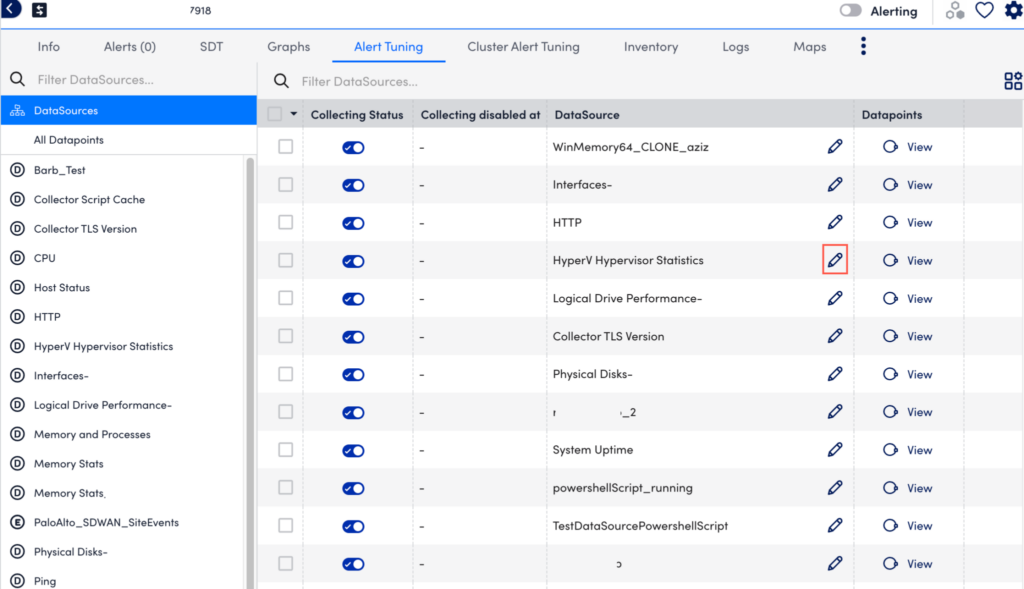
Global-level tuning for datapoint thresholds takes place in the DataSource definition. The DataSource definition can be accessed by navigating to Settings | DataSources or by clicking the Edit Global Definition hyperlink that is available when viewing DataSource or instance data from the Resources tree.

Alert tuning tab

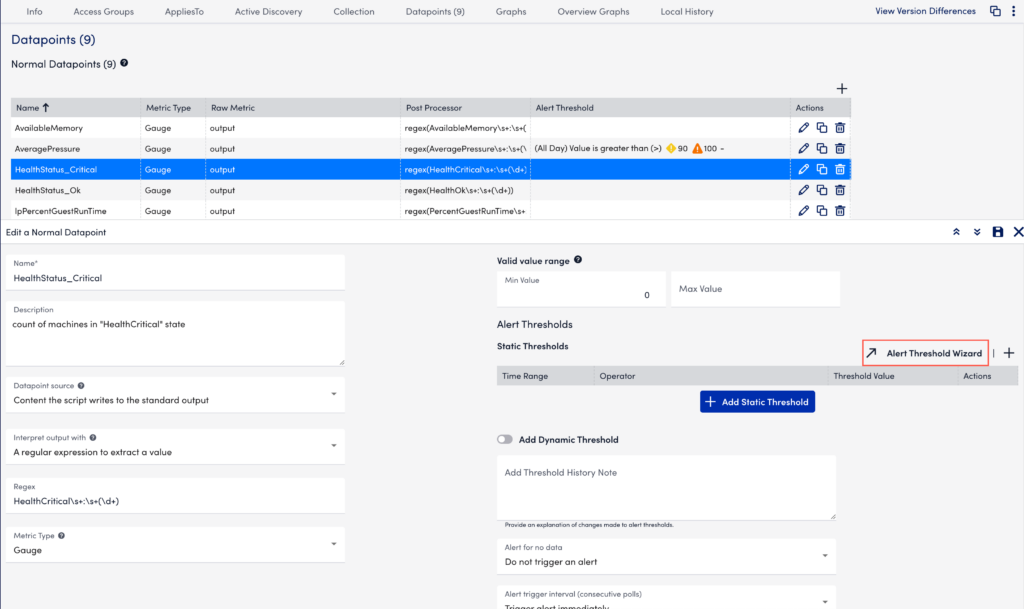
From the edit view of the DataSource definition, you’re able to view and edit all datapoints associated with the DataSource. The most efficient way to edit static datapoint thresholds is through the wizard, which is available by clicking the manage icon to the left of a datapoint and, from the dialog that appears, then clicking the Wizard button which is found next to the Alert threshold field. For more information on configuring the threshold wizard, see the Using the Threshold Wizard section of this support article.

Tuning at the Resource Group Level

Group-level tuning for datapoint thresholds takes place on the Resources page. Navigate to the resource group in the Resources tree and open its Alert Tuning tab. Expand the DataSource to which the datapoint belongs and, from the datapoint list that appears, click the pencil icon in the “Static Threshold” column for the desired datapoint to open its threshold wizard. For more information on configuring the threshold wizard, see the Using the Threshold Wizard section of this support article.

Tuning for alert tuning tab

Note: As mentioned previously, group-level thresholds completely override any global thresholds. If you create time-based thresholds that apply to specific times of the day (discussed in the following Using the Threshold Wizard section of this support article), it’s important that the entire time window for which you want to receive alerts has thresholds set at this group level.

Tuning at the Resource DataSource Level

  1. On the Resources page, from the resources tree, select the datasource you want.
  2. Select the Alert Tuning tab and then from the datapoint table, select the datapoint you want.
  3. In the details panel, select the datapoint that you want to tune.

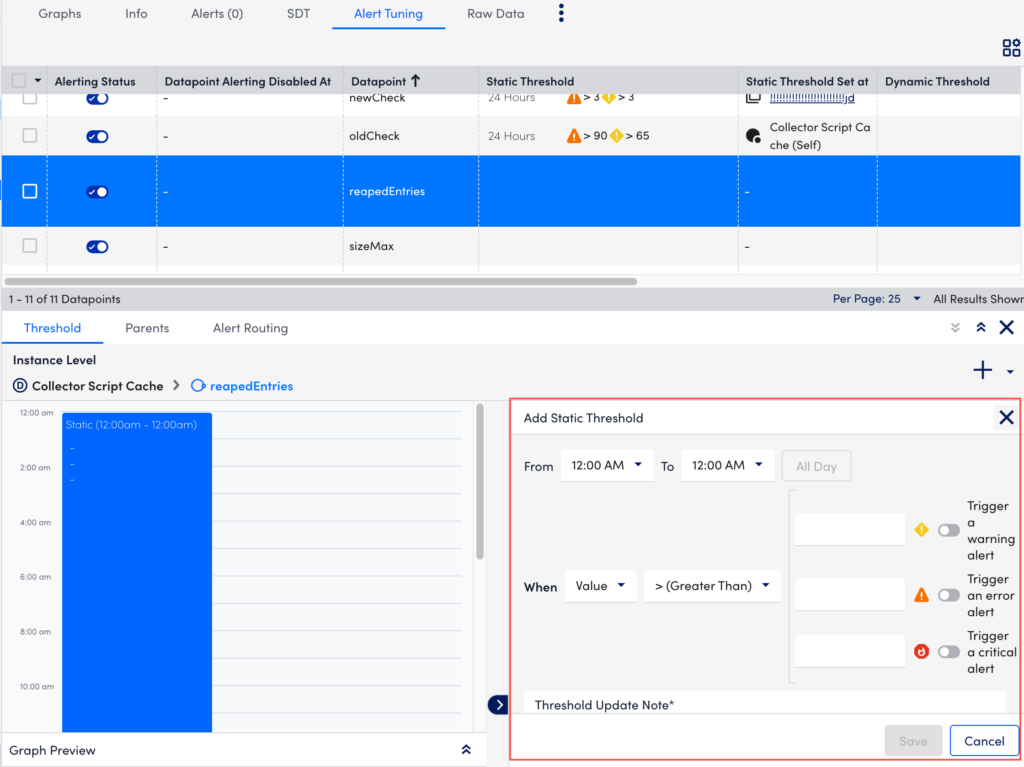
To add a new threshold and set alert tuning parameters to a resource datasource:

  1. Select the datapoint row in the table.
  2. In the details panel, select the Threshold tab.
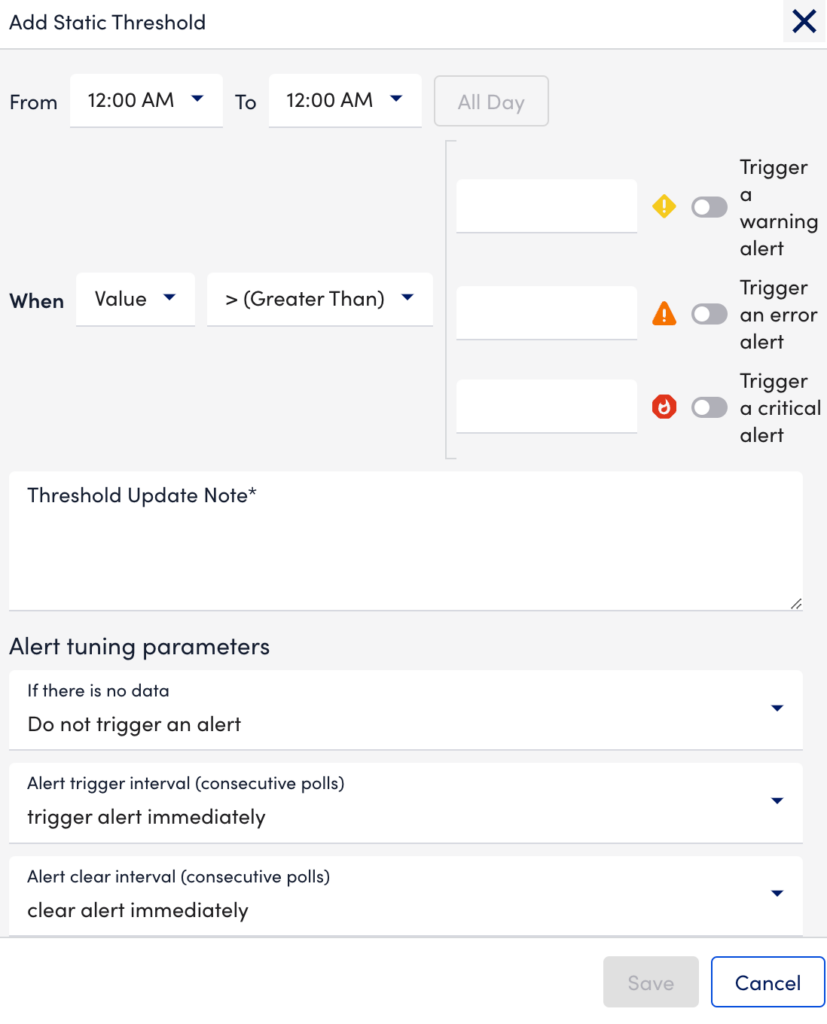
  3. Select +, and then select Static Threshold.
  4. Set the start and end time for the static threshold. The threshold applied as an all-day event.  
  5. Specify the criteria when you want to trigger an alert and add the number of consecutive intervals after which a warning, error, or critical alert should be sent.
  6. Add a threshold update note for future reference.
    datapoint option in Alert tuning
  7. Select Save to apply the settings. 

Note: You can set alert tuning parameters at the Resource DataSource level as well. For more information, see Adding a New Static Threshold and Setting Alert Tuning Parameters.

Tuning at the Instance Group and Instance Level

Instance-level tuning for static datapoint thresholds takes place on the Resources page. There are different entry points for instance-level tuning, depending on whether the owning DataSource is a single- or multi-instance DataSource and whether multiple instances, when present, are organized into instance groups.

Changes made to alerts for instance groups within a resource will only be applied to the instances that are currently present in the instance group. New instances that are added or discovered later will inherit the threshold properties of the instance group. If there are no instance or resource level thresholds set, new instances will inherit the datasource (global) level thresholds.

Tuning a Datapoint Threshold for a Single Instance

To tune the static datapoint threshold for a single-instance DataSource (and thus a single instance), navigate to the DataSource in the Resources tree. (The resource that the DataSource is nested under matters as you are only updating the instance that pertains to that particular resource.) Open the Alert Tuning tab, find the datapoint whose threshold you would like to edit, and click the pencil icon found in the “Static Threshold” column. This opens the threshold wizard which is discussed in detail in the Using the Threshold Wizard section of this support article.

To tune the threshold for a single instance of a multi-instance DataSource, navigate to the instance in the Resources tree, open its Alert Tuning tab, find the datapoint whose threshold you would like to edit, and click the pencil icon found in the “Static Threshold” column. This opens the threshold wizard. See the Using the Threshold Wizard section of this support article.

Tuning a Datapoint Threshold for Multiple Instances at Once

In addition to tuning static datapoint thresholds for a single instance, you can also tune thresholds for multiple instances at once. This saves time if your end goal is to tune thresholds for all instances (or a subset of instances, called an instance group) found on a resource. For more information, see Instance Groups.

To tune multiple instances at once, use the Resources tree to navigate to either the multi-instance DataSource (assuming you want to tune all instances on the resource at once) or one of its instance groups (assuming you want to tune only a subset of the instances). Open the Alert Tuning tab, find the datapoint whose threshold you would like to edit for all instances across the resource or instance group, and click the pencil icon found in the “Static Threshold” column. This opens the threshold wizard. See the Using the Threshold Wizard section of this support article.

Using the Threshold Wizard

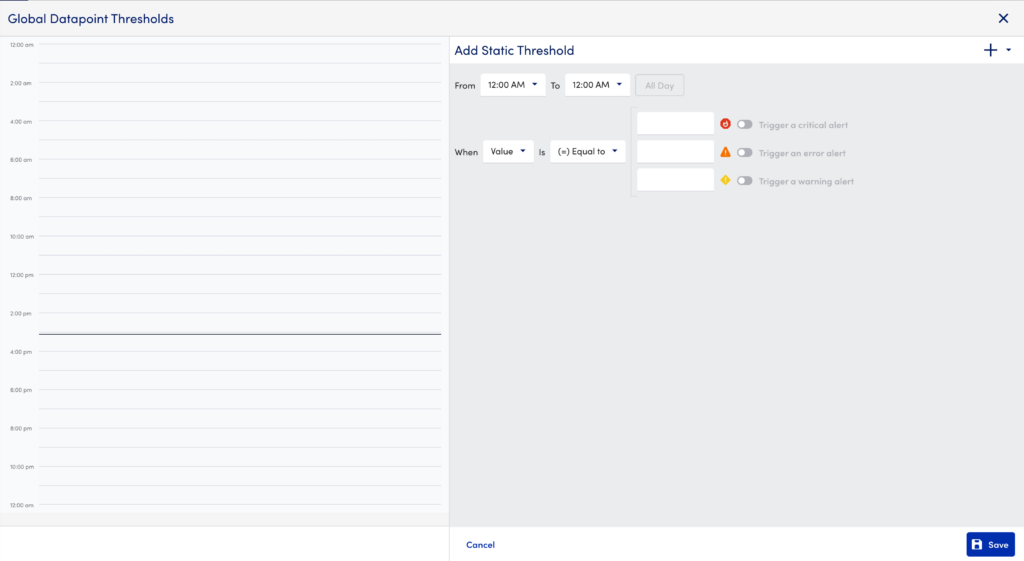
The most thorough method for adding or adjusting static datapoint thresholds is to use the threshold wizard. As described in the previous section of this support article, there are many ways to arrive at this wizard, depending upon the level at which you would like your adjustments to apply.

Upon opening the threshold wizard, you will see any thresholds currently set for the datapoint, in top to bottom order, according to hierarchical level. For example, if you are viewing thresholds set for a datapoint for a single instance, you would see the instance-level thresholds first (if any), followed by the resource group thresholds (if any), followed by the global thresholds. LogicMonitor evaluates the thresholds in the order in which they display, meaning that instance-level thresholds override resource-group-level thresholds, which override global thresholds, as discussed in the previous Determining the Level at Which Static Datapoint Thresholds Should Be Adjusted section of this support article.

Instance threshold page
The effective datapoint threshold for the instance shown here is the threshold listed first. Thresholds are also set for the resource group that the instance is a member of, as well as the global DataSource that applies to the instance. But because these thresholds are set at a more broad level, it is the instance-level threshold that LogicMonitor will evaluate to determine whether this instance is in an alert condition.

You can only edit or add thresholds at the level from which you arrived at the threshold wizard. For example, if you opened the threshold wizard from a global DataSource definition, then only global thresholds are available for adding/editing. If you arrived at the threshold wizard from a resource group’s configurations, then only resource group thresholds are available for adding/editing.

Once you’ve arrived at the threshold wizard, follow these steps to add or edit the threshold for a datapoint:

  1. If you are editing an existing threshold, click the arrow to its left to expand its settings. If you are adding a new threshold (either at a different level or at the same level but for a different time frame), click the plus sign icon.
    Editing or adding alert thresholds from the wizard

  2. If you would like the threshold to be effective for a time frame that is more narrow than the default “All Day” time frame, open the dropdown to select a start time. Then choose an end time from the second dropdown that appears. Multiple sets of thresholds can only exist at the same level if they specify different time frames.
  3. Select a comparison method. The following methods are available:
    • Value. Compares the datapoint value against a threshold
    • Delta. Compares the delta between the current and previous datapoint value against a threshold
    • NaNDelta Operates the same as delta, but treats NaN values as 0
    • Absolute value Compares the absolute value of the datapoint against a threshold
    • Absolute delta Compares the absolute value of the delta between the current and previous datapoint values against a threshold
    • Absolute NaNDelta Operates the same as absolute delta, but treats NaN values as 0
    • Absolute delta% Compares the absolute value of the percent change between the current and previous datapoint values against a threshold
  4. Select a comparison operator.
  5. For one or more of the severity levels, specify the value that will trigger that alert severity.

    If you add the same threshold value to more than one severity level, the higher severity level takes precedence. For example, if you set both the warning and error severity level thresholds at 100, then a datapoint value of 100 will trigger an error alert.

    If the datapoint value jumps from a lower severity level to a higher severity level, the alert trigger interval count (the number of consecutive collection intervals for which an alert condition must exist before an alert is triggered) is reset, as discussed in Datapoint Overview.

  6. Click the Save & Close button.
  7. You are prompted to enter a note describing the purpose behind the change. As discussed in the Threshold History Log and Reporting section of this support article, this note is added to the threshold history log.

Managing Thresholds

Viewing Threshold History

When you add or update a threshold, the changes are captured and displayed under History. In the threshold history, you can view the following details:

  • Name of the user who made the changes
  • Date and timestamp
  • Nature of change – add or update
  • Configuration change details
Alert tuning history tab

Note: If making threshold edits at the global DataSource definition level, the DataSource itself must ultimately be saved (requiring you to save at the wizard level, the datapoint dialog level, and ultimately the DataSource level) in order for the Threshold History log to be updated.

Alerts Thresholds Report

The Alerts Thresholds report provides visibility into static datapoint thresholds set across your LogicMonitor platform. It reports on the thresholds in effect across multiple resources, including detailing thresholds that have been overridden and resources for which alerting has been disabled. To learn more about this report, see Alert Thresholds Report.

Viewing Threshold Hierarchy

Under the Parents tab of a datapoint, you can view the threshold hierarchy of a datapoint. You can view both static and dynamic threshold configured for a datapoint. The global level threshold is placed at the top and the order is: DataSource > Resource group > Resource DataSource > Instance group > Instance.

  1. Select the datapoint row in the table.
  2. In the details panel, select the Parents tab. Depending on the threshold configuration, the hierarchy is displayed.
    Alert tuning parents options

Editing Threshold

  1. Select the datapoint row whose threshold you want to edit.
  2. In the details panel, select the Threshold tab.
  3. Select the threshold that you want to edit. The Edit Static Threshold panel is displayed.
  4. Edit the threshold and select Save.
    Threhold option for Alert tuning

Deleting Threshold

  1. Select the datapoint row whose threshold you want to delete.
  2. In the details panel, select the Threshold tab.
  3. Select the threshold that you want to delete. The Edit Static Threshold panel is displayed.
  4. Select the Delete Threshold icon. A pop up confirming deletion is displayed.
  5. Enter the threshold update note and select Delete.
    delete thershold dialog box

Examples

Next are some examples of static datapoint threshold configurations and how they will apply in the LogicMonitor platform.

Example 1: Global Datapoint Threshold

Global threshold page
There are two sets of thresholds set at the global level for this datapoint. Each threshold is active during different time windows of the day (notice how the threshold labels align with the hourly timeline that runs along the bottom of the wizard). If CPU metrics for this datapoint reach 90 at any point during the day, a warning alert will trigger. However, between 9am and 8pm, the warning alert will trigger at 80 instead of 90.

Example 2: Resource Group Datapoint Threshold

group threshold option
Building upon the previous example (example 1), there are three sets of thresholds set at the “Windows Server” resource group level for this datapoint. If CPU metrics for any devices in this particular resource group reach 75 between the hours of 5am and 9pm PDT, a warning alert will trigger. For the remaining hours in the day, no other alerts will trigger because group-level thresholds completely override global-level thresholds.

Example 3: Instance Datapoint Threshold

Instance threshold page
Building upon the previous two examples (examples 1 and 2), there are four sets of thresholds set at the “WinCPU” instance level for this datapoint. If CPU metrics for this particular instance reach 50 at any point during the day, a warning alert will trigger. Although there are other thresholds listed for this instance that pertain to the resource group the instance is a member of and the DataSource that applies to the instance, the instance-level threshold will always be the only one ever evaluated, not only because it is set for “All Day”, but also because instance-level thresholds completely override thresholds at the group and global level.

In This Article