Disclaimer: This content applies to the legacy UI and is no longer maintained. It will be removed at a future time. For up-to-date content, see Normal Datapoints. At the time of removal, you will automatically be redirected to the up-to-date content.
Normal Datapoints
Last updated - 20 February, 2026
Overview
A datapoint is a piece of data that is collected during monitoring. Every DataSource definition must have at least one configured datapoint that defines what information is to be collected and stored, as well as how to collect, process, and potentially alert on that data. LogicMonitor defines two types of datapoints: normal datapoints and complex datapoints.
Normal datapoints represent data you’d like to monitor that can be extracted directly from the raw output collected. Complex datapoints, on the other hand, represent data that needs to be processed in some way using data not available in the raw output (e.g. using scripts or expressions) before being stored. For more information on complex datapoints, see Complex Datapoints.
Normal datapoints are configured from the DataSource definition, as outlined in Datapoint Overview. In this support article, we’ll discuss in detail the various configurations that make up a normal datapoint.
Normal Datapoint Metric Types
When configuring a normal datapoint from the DataSource definition, one of three metric types can be assigned: gauge, counter, or derive.
Gauge Metric Type
The gauge metric type stores the reported value directly for the datapoint. For example, data with a raw value of 90 is stored as 90.
Counter Metric Type
The counter metric type interprets collected values at a rate of occurrence and stores data as a rate per second for the datapoint. For example, if an interface counter is sampled once every 120 seconds and reports values of 600, 1800, 2400, 3600 respectively, the resulting stored values would be 10 = ((1800-600)/120), 5 = ((2400-1800)/120) and 10 = ((3600-2400)/120).
Counters account for counter wraps. For example, if one data sample is 4294967290, and the next data sample, occurring one second later, is 6, the counter will store a value of 12, and assume the counter wrapped on the 32-bit limit. This behavior can lead to incorrect spikes in data if a system is restarted, and counters start again at 0 (i.e. the counter metric type may assume a very rapid rate caused a counter wrap, and therefore stores a huge value). For this reason, it is advisable to set max values for datapoints that are assigned counter metric types. This is accomplished using the Valid Value Range field available when configuring datapoints from the DataSource definition, as discussed in Datapoint Overview.
It is rare that you will have a use case for a counter metric type. Unless you are working with a datapoint that wraps frequently (e.g. a datapoint for a gigabit interface and using a 32-bit counter), you should use a derive metric type instead of counter.
Derive Metric Type
Derive metric types are similar to counters, with the exception that they do not correct for counter wraps. Derives can return negative values.
Configuring the Raw Output to Be Collected for a Normal Datapoint
When configuring a datapoint from the DataSource definition (as discussed in Datapoint Overview), there is a field (or set of options) that specify what raw output should be collected. However, the wording for these fields/options dynamically changes, depending upon the collection method being used by the DataSource (as determined by the Collector field, see Creating a DataSource).
For example, this field is titled WMI CLASS attribute when defining datapoints collected via WMI and titled OID when defining datapoints collected via SNMP. Similarly, if defining datapoints collected via JMX, the fields MBean object and MBean attribute display. And to provide one more example, if defining datapoints collected via script or batchscript, a listing of script source data options displays. For more information on configuring this dynamic raw output field, see the individual support articles available in our Data Collection Methods topic.
Post Processing Interpretation Methods for Normal Datapoints
The data collected from your devices can sometimes be used directly (e.g. the exit code returned by a script when using the script collection method), but other times requires further interpretation. When further interpretation is available for a collection method, the Interpret output with field becomes available in the datapoint’s configurations (which are found in the DataSource definition).

This field informs LogicMonitor on how to extract the desired values from the raw output collected. If the default “No interpretation: use directly” option is selected, the raw output will be used as the datapoint value; typically, DataSources with an SNMP collection method leave the raw output unprocessed as the numeric output of the OID is the data that should be stored and monitored.
The following sections overview the various interpretation methods available for processing collected data. The methods available for a particular datapoint are dependent on the type of collection method being used by the DataSource (as determined by the Collector field, see Creating a DataSource).
Multi-Line Key-Value Pairs
This interpretation method treats a multi-line string raw measurement as a set of key-value pairs separated by an equal sign or colon.
Buffers=11023
BuffersAvailable=333
heapSize=245MB
For the above multi-line string, you would extract the total number of buffers by specifying “Buffers” as the key, shown next.

Note: Key names should be unique for each key-value pair. If a raw measurement output contains two identical key names paired with different values, where the separating character (equal sign or colon) differs, the Key-Value Pairs Post Processor method will not be able to extract the values.
Regular Expressions
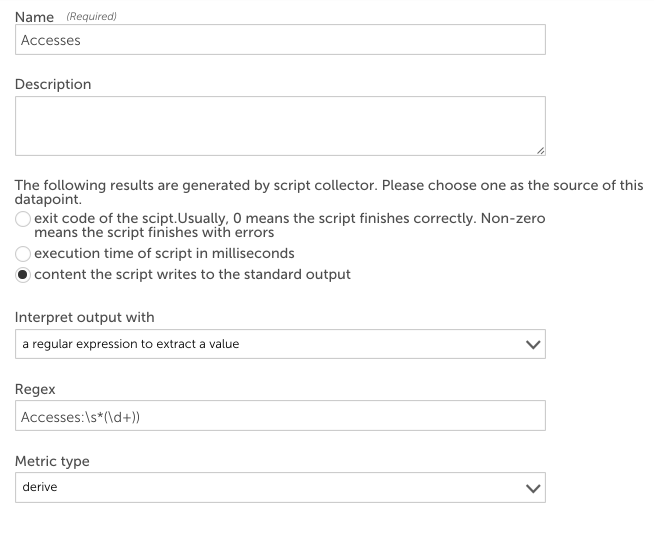
You can use regular expressions to extract data from more complex strings. The contents of the first capture group – i.e. text in parenthesis – in the regex will be assigned to the datapoint. For example, the Apache DataSource uses a regular expression to extract counters from the server-status page. The raw output of the webpage collection method looks similar to the following:
Total Accesses: 8798099
Total kBytes: 328766882
CPULoad: 1.66756
Uptime: 80462
To extract the Total Accesses, you could define a datapoint as follows:

TextMatch
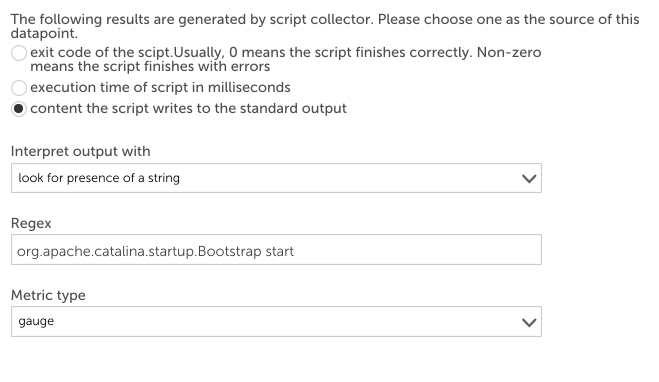
Look for presence of a string (TextMatch) tests whether a string is present within the raw output. This method supports regular expressions for text matching. If the string exists, it returns 1, otherwise 0.
For example, to check if Tomcat is running on a host, you may have a script datasource that executes
ps -ef | grep java periodically. The output from the pipeline should contain
org.apache.catalina.startup.Bootstrap start if Tomcat is running.
The datapoint below checks if the raw measurement output contains the string org.apache.catalina.startup.Bootstrap start. If yes, the datapoint will be 1 indicating Tomcat is running, otherwise the datapoint value will be 0.

CSV and TSV
If the raw measurement is an array of comma-separated values (CSV) or of tab-separated values (TSV), you can use the CSV and TSV methods to extract values, respectively.
There are three forms of parameters that the post processor will accept for CSV and TSV methods:
- A simple integer N. Extract the Nth element of the first line of input (elements start at zero)
- Index=Nx,Ny. Extract the Nxth element of the Nyth line of the input
- Line=regex index=Nx. Extract the Nxth element of the first line which matches the given regex
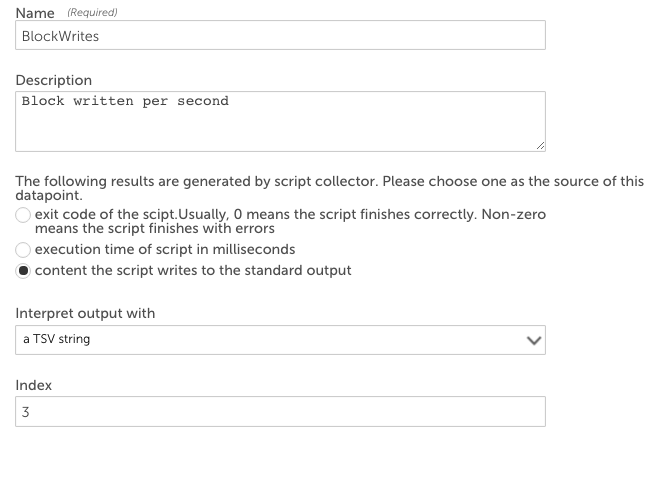
For example, a script datasource executes iostat | grep ‘sda’ | head -1 to get the statistics of hard disk “sda”. The output is a TSV array:
sda 33.75 3.92 719.33 9145719 1679687042The fourth column (719.33) is blocks written per second. To extract this value into a datapoint using the TSV interpretation method, select “a TSV string” as the method to interpret the output and enter “3” as the index, shown next.

HexExpr
The “Hex String with Hex Regex Extract Value” (HexExpr) method only applies to the TCP and UDP data collection methods. It is applied to the TCP and UDP payloads returned by these collection methods.
The payload is treated as a byte array. You specify an offset and a length that could be 1, 2, 4, or 8 (corresponding to data type byte, short, int, or long, respectively) in the format of
offset:length in the Regex field. HexExpr will return the value of the byte (short, int, or long) starting at
offset of the array.
For interpreting 32-bit values, you can also specify the underlying byte ordering with the following method selections:
- A Big-Endian 32-bit Integer Hex String with Hex Regex Extract Value
- A Little-Endian 32-bit Integer Hex String with Hex Regex Extract Value
The HexExpr method can be very useful if you’d like a datapoint to return the value of a field in binary packets such as DNS.
XML
The XML Document interpretation uses XPath syntax to navigate through elements and attributes in an XML document. For example, if the webpage collection method was used to collect the following content…
<Order xmlns="https://www.example.com/myschema.xml">
<Customer>
 <Name>Bill Buckram</Name>
 <Cardnum>234 234 234 234</Cardnum>
</Customer>
<Manifest>
 <Item>
  <ID>209</ID>
  <Title>Duke: A Biography of the Java Evangelist</Title>
  <Quantity>1</Quantity>
  <UnitPrice>12.75</UnitPrice>
 </Item>
 <Item>
  <ID>204</ID>
  <Title>
  Making the Transition from C++ to the Java(tm) Language
  </Title>
  <Quantity>1</Quantity>
  <UnitPrice>10.75</UnitPrice>
 </Item>
</Manifest>
</Order>
…you could extract the order ID for the book “Making the Transition from C++ to the Java Language” from the XML page above by specifying in the datapoint configuration that the HTTP response body should be interpreted with an XML document and entering the following Xpath into the Xpath field:
Order/Manifest/Item[normalize-space(Title)=”Making the Transition from C++ to the Java(tm) Language”]/ID

Any Xpath expression that returns a number is supported. Other examples that could be used to extract data from the sample XML above include:
- count(/Order/Manifest/Item)
- sum(/Order/Manifest/Item/UnitPrice)
JSON
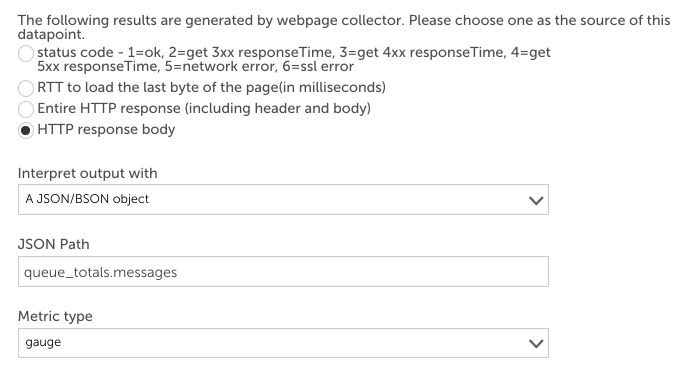
Some collection methods return a JSON literal string as the value of one of the raw datapoints. For example, you can create a webpage DataSource sending an HTTP request
/api/overview to RabbitMQ server to collect its performance information. RabbitMQ returns a JSON literal string like this:
{
  "management_version":"2.5.1",
  "statistics_level":"fine",
  "message_stats":[],
  "queue_totals":{
    "messages":0,
    "messages_ready":0,
    "messages_unacknowledged":0
  },
  "node":"rabbit@labpnginx01",
  "statistics_db_node":"rabbit@labpnginx01",
  "listeners":[
    {
      "node":"rabbit@labpnginx01",
      "protocol":"amqp",
      "host":"labpnginx01",
      "ip_address":"::",
      "port":5672
    }
  ]
}
You could create a datapoint that uses the JSON/BSON post-processor to extract the number of messages in the queue like this:

Members can be retrieved using dot or subscript operators. LogicMonitor uses the syntax used in JavaScript to identify objects. For example, “listeners[0].port” will return 5672 for the raw data displayed above.
LogicMonitor supports JSON Path to select objects or elements. A comparison of Xpath and JSON Path syntax elements:
{
     "store":{
        "book":[
          {
               "title":"Harry Potter and the Sorcerer's Stone",
               "price":"10.99"
          },
          {
               "title":"Harry Potter and the Chamber of Secrets",
               "price":"10.99"
          },
          {
               "title":"Harry Potter and the Deathly Hallows",
               "price":"9.99"
          },
          {
               "title":"Lord of the Rings: The Return of the King",
               "price":"17.99"
          },
          {
               "title":"Lord of the Rings: The Two Towers",
               "price":"17.99"
          }
        ]
     }
}
To retrieve the total price of all the books, you could use the aggregate function of
sum($.store.book[*].price), shown next.

To break this down: sum is the aggregate function. $ is the start of JsonPath. * is a wildcard to return all objects regardless of their names. Then the price element for each object is returned.
The aggregate functions can only be used in the outermost layer.
Regex filter =~
The Regex Filter =~ can be used to select all elements that match the specified regex expression. For example, to calculate the sum of the price of all the books in the Harry Potter series, you could use the following expression:

This expression can be broken down as the sum of the price of all books in the store that pass the filter expression (i.e. those whose title match the regex “Harry Potter’). You can use regex match only in filter expressions.
“@” means the current object which represents each book object in the book array in the example.


