
Collector Performance and Tuning
Last updated - 04 March, 2025
Collector resource consumption (CPU and memory usage) and collector performance are closely linked. Collector tuning involves adjusting collector configuration or redistributing workload to efficiently monitor resources and collect data. Collector tuning is done to data collection tasks such as WMI, SNMP, and so on. If there are data gaps or no data is reported for datasources of a single collection type then collector tuning is done.
Scenarios Requiring Collector Tuning
Collectors are configured to work well in most environments, but may need tuning in the following scenarios.
- Collector overload
- Unresponsive devices
- Inability to collect data
Collector Overload
Collector overload involves the following common indicators:
- After setting up collector for monitoring, the Collector Data Collecting Task datasource alerts you that the collector is unable to schedule tasks. This happens because the data is not collected as per the datasource schedule and may also result in gaps in graphs. In such cases, the workload of a collector needs tuning. For more information, see Monitoring Your Collectors.
- The presence of elements in the task queue indicate that a collector has to wait for scheduling tasks, but is still able to complete tasks in the given time frame. This indicates that the collector is approaching its configured capacity and needs tuning.
Collector Overload Examples
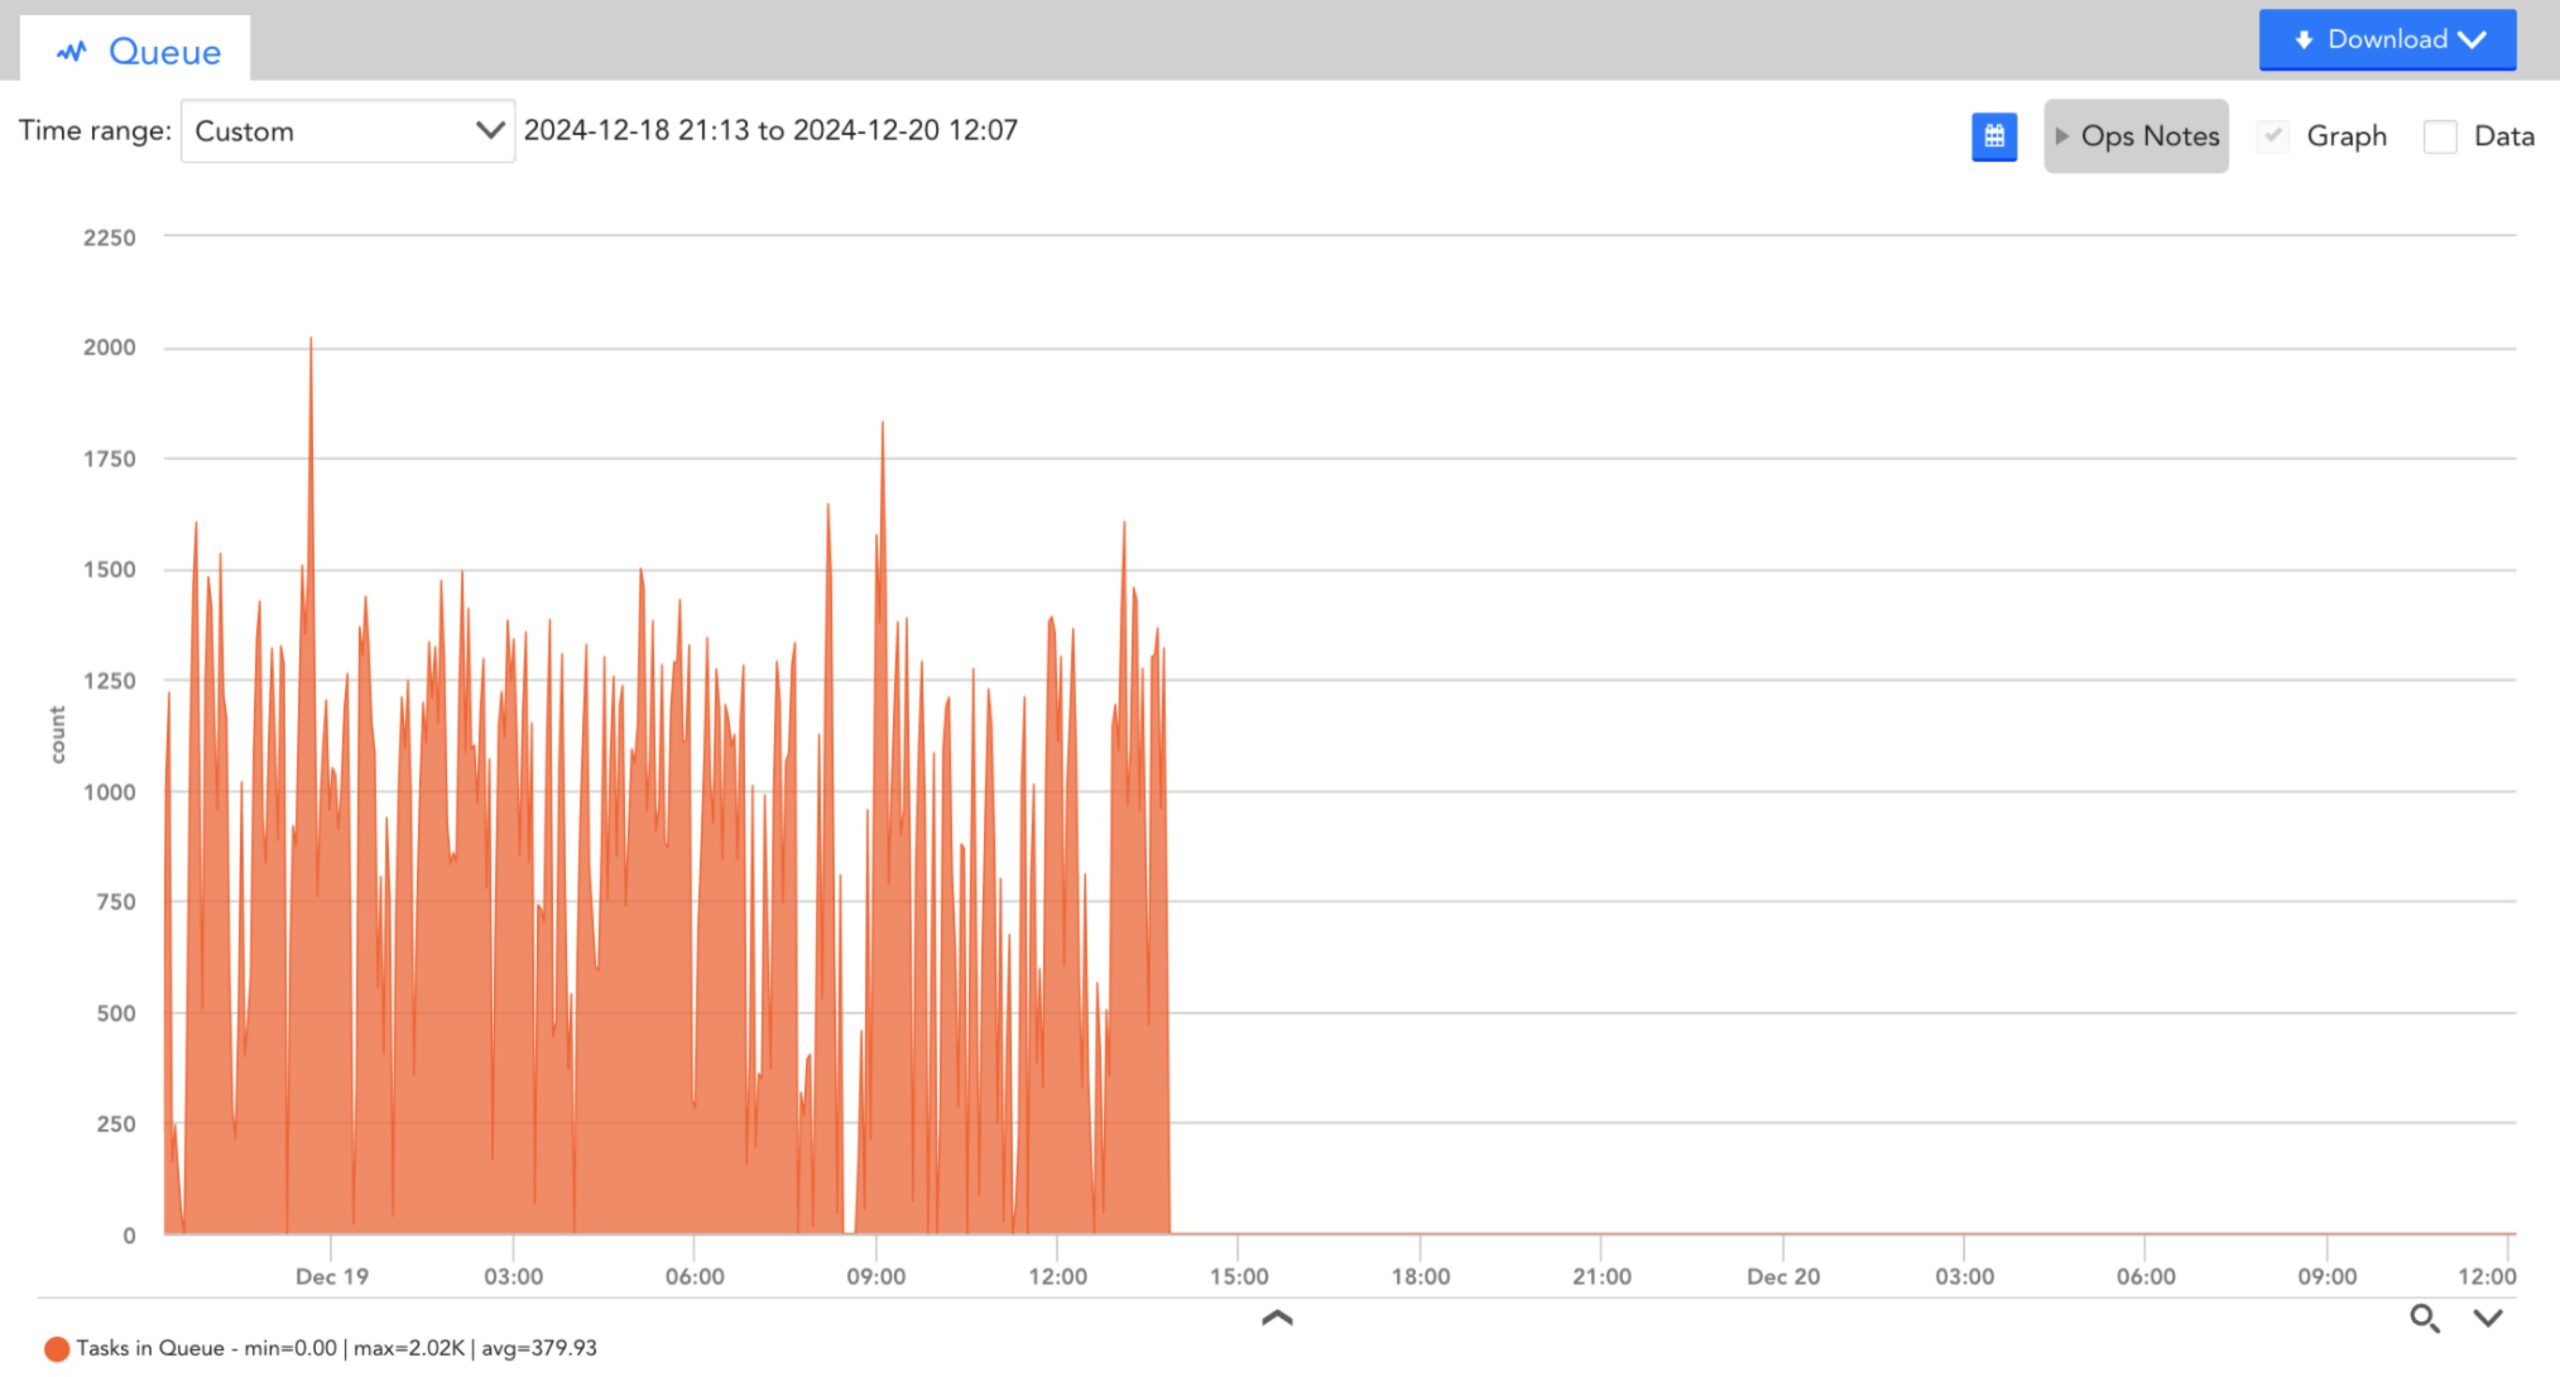
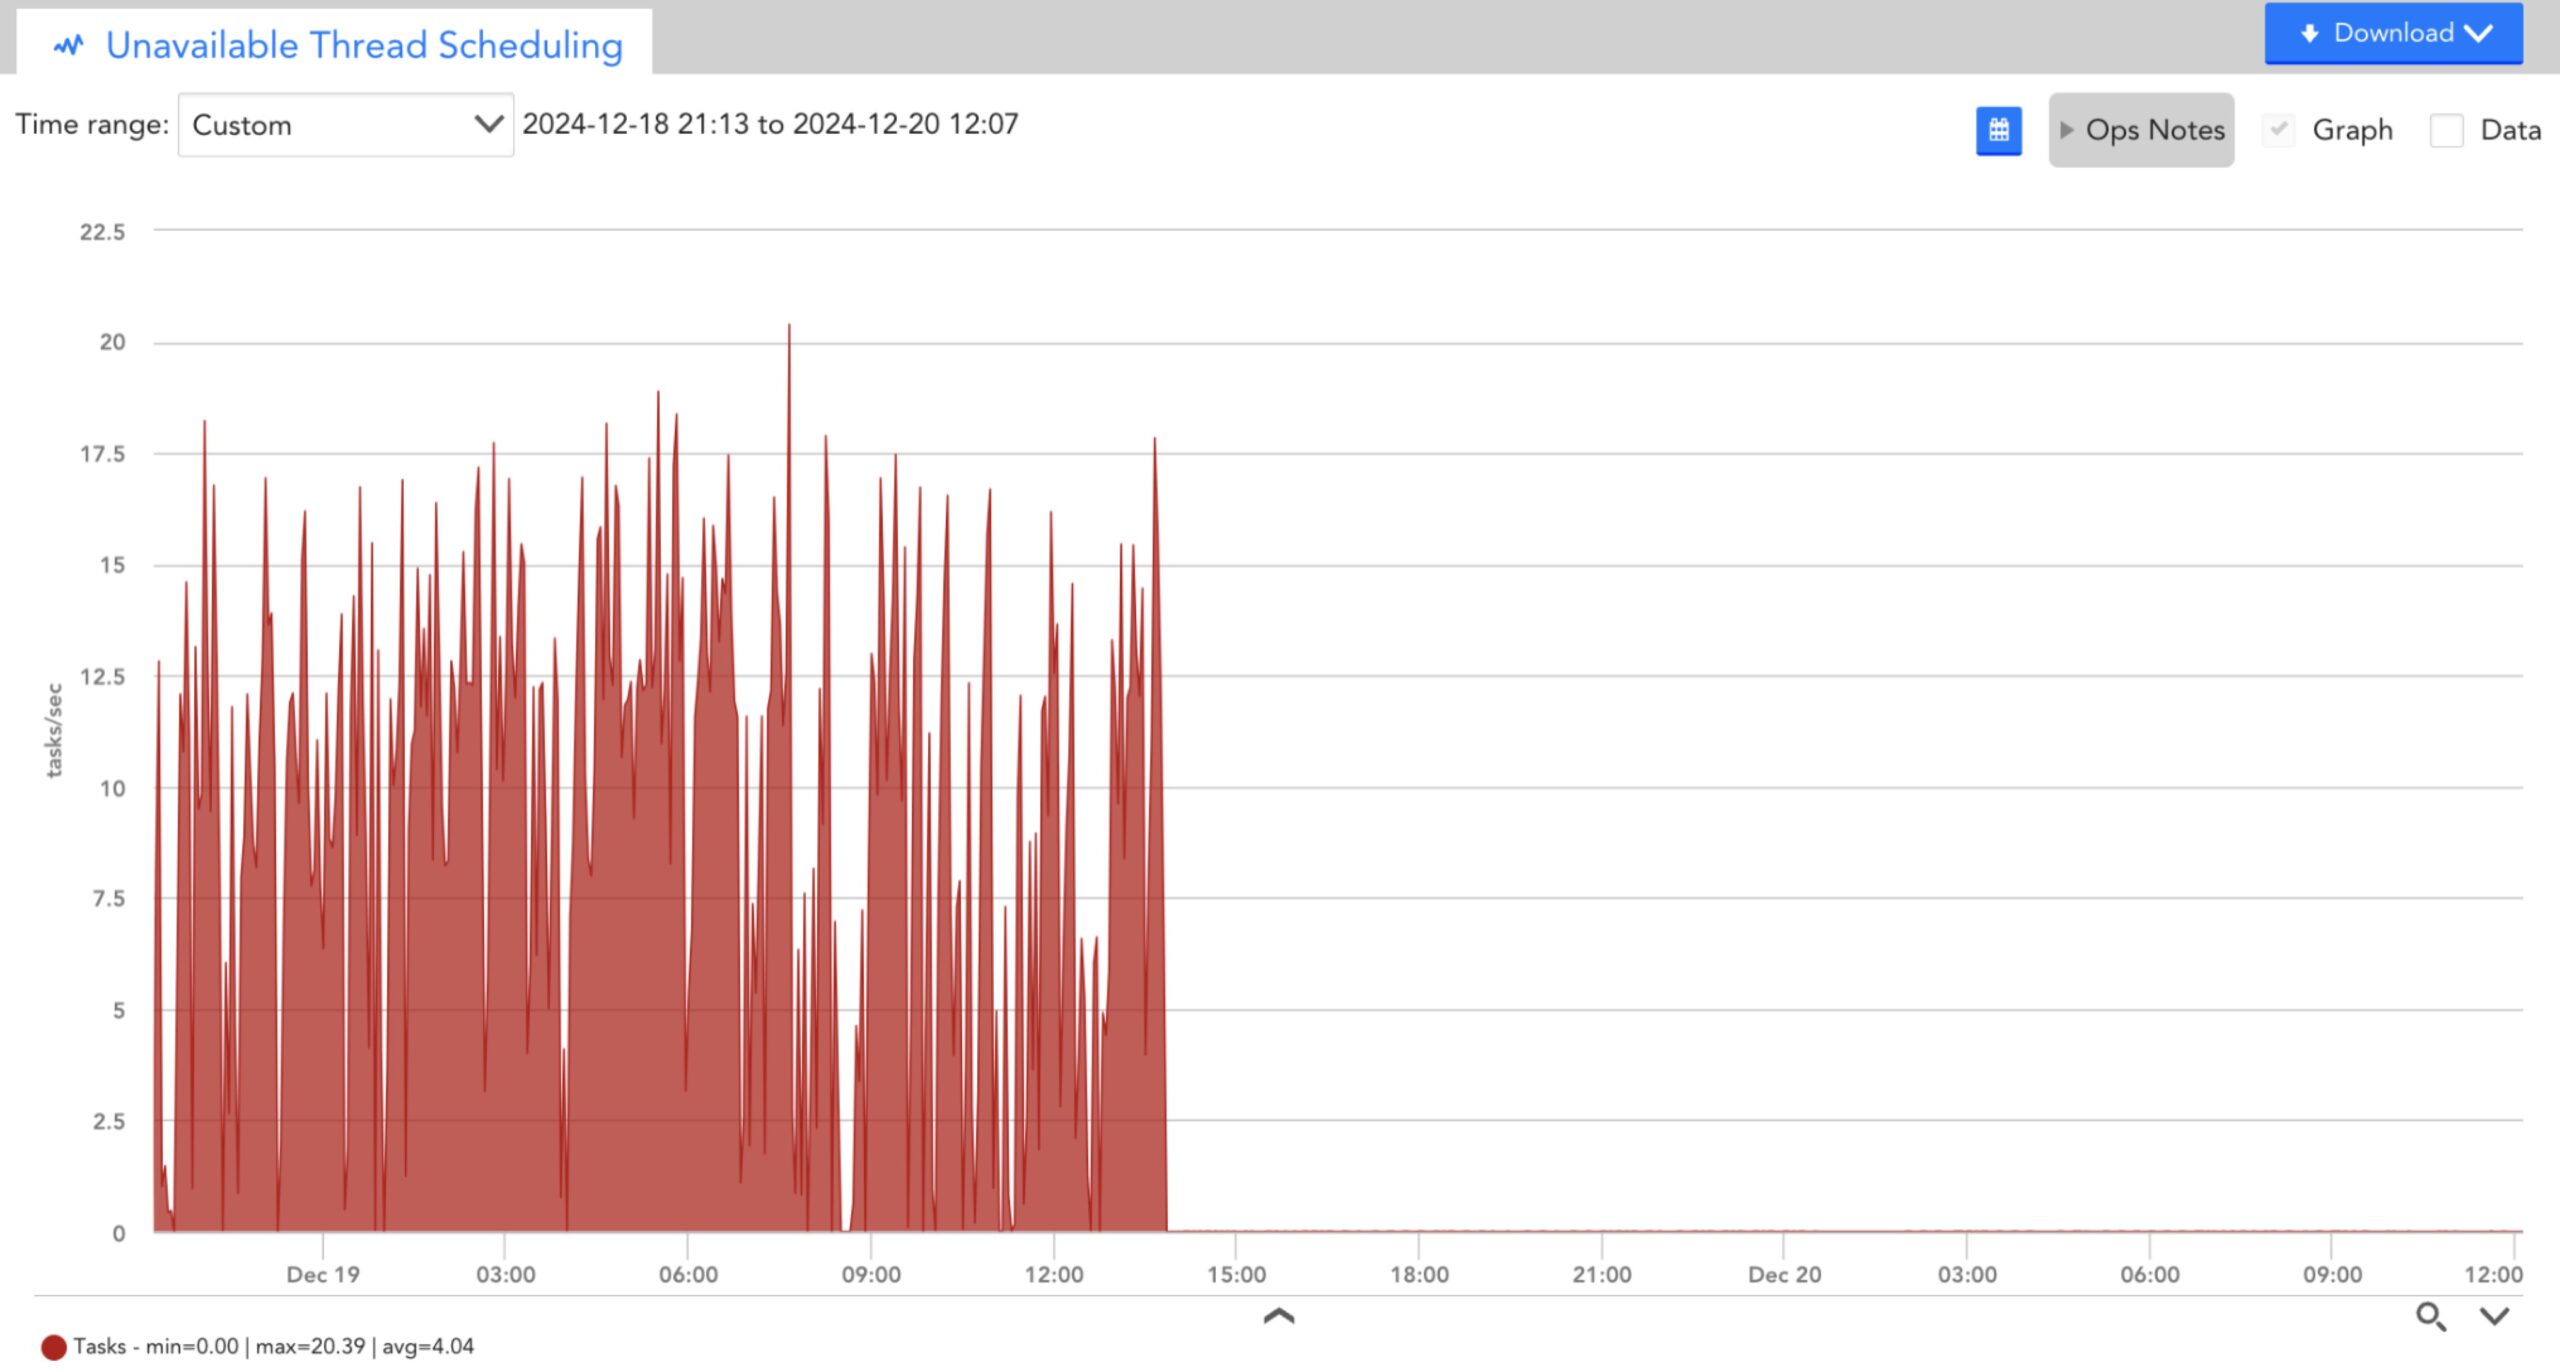
You can observe that the collector datasources clearly indicate an overloaded collector. There are many tasks that cannot be scheduled and the task queue is very high.
- Tasks in queue
- Unavailable thread scheduling tasks
- Executed tasks
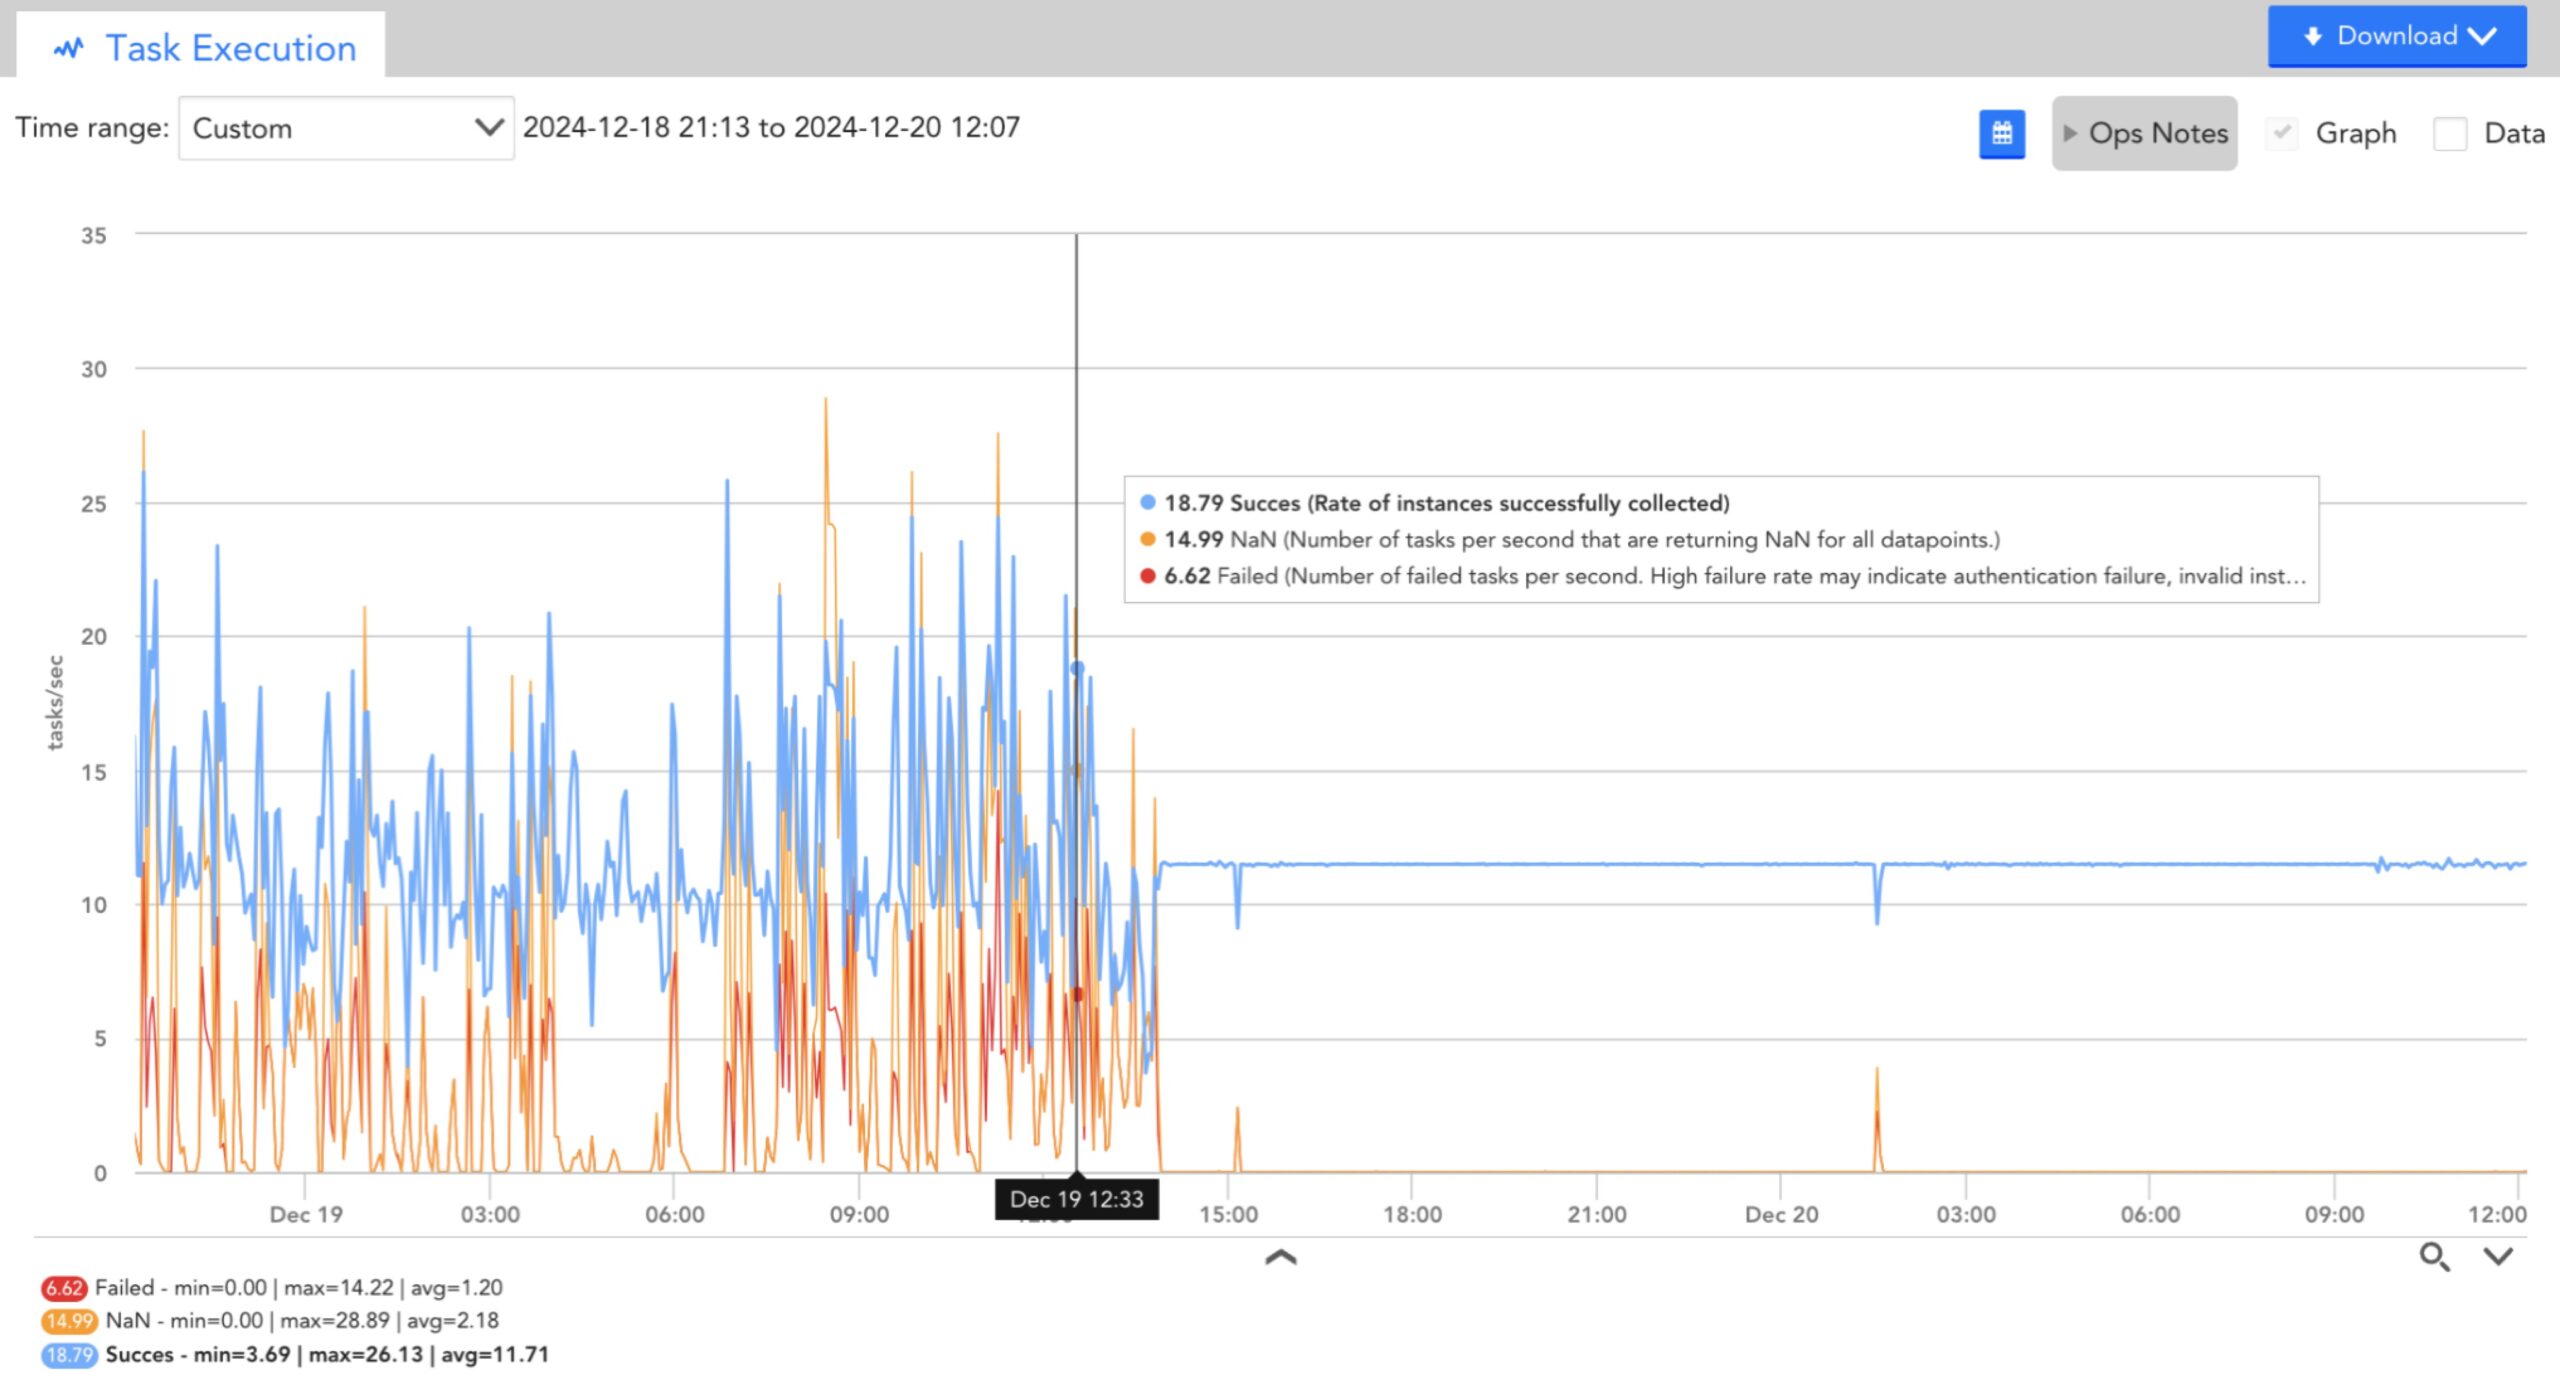
After tuning (post 1400hrs), you can observe that the number of successful tasks has increased, the number of unavailable thread scheduling tasks and the task queue has dropped.
As a proactive measure, you can create a collector dashboard and custom graph displaying the top 10 collectors by the datapoint UnavailableScheduleTaskRate for all instances of the Data Collecting Task datasource on all devices, and another graph displaying the top 10 collectors by TasksCountInQueue. Considering that each collector has many instances of these datasources (one for each collection method), you may have to specify the collection methods as instances such as snmp and jmx so that it does not exceed the instance limit on a custom graph. Alternatively, you can set instances to a star (*) to see all methods on one graph.
Unresponsive Devices
The following are scenarios of collector performance degradation due to unresponsive devices:
Collector Slowdown due to Unresponsive Devices
Collectors often are unable to deal with the same devices they have been monitoring if some devices no longer respond. For example, a collector monitors 100 devices with no queuing, but then starts experiencing task queues or is unable to schedule tasks. This can happen because the collector can no longer collect data from some of the devices. If it was talking to all those devices via JMX, and each device normally responded to a JMX query in 200 ms, it could cycle through all the devices easily. However, if the JMX credentials now mismatch on the 10 hosts, then they do not respond to LogicMonitor queries. The collector keeps a thread open until the configured JMX times out. It will now keep several threads open and wait for responses.
Unresponsive Devices in Collector Queries
A device can fail to respond to collector query due to multiple reasons such as the device credentials have changed, the device is offline, LogicMonitor credentials are incorrectly set, and so on. You can find the reason from the alerts about the protocol not responding to the device. To resolve these issues and resume monitoring of the devices, you can set new credentials, ensure that the device is online, or set LogicMonitor credentials correctly.
Sometimes, the reason for devices failing to respond to collector query are not know. In such situations, you can run collector debug command to check if the issue is with the tasks scheduled by the collector. If you run the command !tlist c=METHOD, where method is the data collection method at issue (for example, jmx, snmp, and WMI), you will get a list of all the tasks of the selected method the collector has scheduled.
Multiple tasks failing due to timeout or no response indicates that these tasks keep a thread busy for the timeout period of that protocol. In this situation, you must reduce the configured timeout to stop threads from blocking for a long time. If the JMX timeout is 30 seconds which is a very long time for a computer to respond, you can set it to 5 seconds (the current default). When setting the timeout ensure that the revised timeout is suitable with your environment.
To change the timeout for a protocol, follow these steps:
- From the Collector Configuration window, manually edit the collector configuration.
- Edit the collector.*.timeout parameter to change the timeout for the protocol that you want to update. For example, change
collector.jmx.timeout=30tocollector.jmx.timeout=5
Note: While it may be appropriate to set the JMX timeout to 5 seconds, the webpage collector will still need 30 seconds, as web pages require more time to render. For web pages, setting a timeout to a shorter period will adversely affect monitoring.
In addition to reducing the timeout period, you may also need to increase the number of threads.
Unable to Collect Data
If a collector is unable to collect data, you may need to increase the number of threads for a collection method. This enables the collector to perform more tasks simultaneously (especially if some threads are waiting for timeout). However, it will lead to an increase in the collector CPU usage.
To increase the threads for a collection method, follow these steps:
- From the Collector Configuration window, manually edit the collector configuration.
- Edit the collector.*.threadpool parameter to increase the threadpool allotment for the protocol that you want to update. For example, increase
collector.jmx.threadpool=50tocollector.jmx.threadpool=150.
Recommendation: You can gradually increase the threadpool setting. Initially, you can double the current setting, and observe its impact. You must note the changes in the collector CPU utilization and heap utilization. An increase in the number of threads will consume more CPU and place additional pressure on the JVM heap. If the heap usage (displayed under the Collector Datasource Collector JVM Status) is approaching the limit, you may increase the heap usage limit.
Inspite of increasing the number of threads and heap limit, if a collector is not able to collect data or is hitting CPU capacity, it is recommended to add another collector and split the workload between the collectors.
Tuning the Collector
Based on the nature of the issues that collector encounters, you can tune collectors. Collector tuning involves the following measures:
- You can modify collector configurations as per the collector size. For more information, see Editing the Collector Config Files.
- You must verify if the server running the collector has sufficient memory. If needed, you must increase the memory.
- Increase the collector size. For example, a small size collector only uses 2 GB memory, but can perform more work if upgraded to a larger size. For more information, see Collector Capacity.
