
Dashboard Filters
Last updated - 11 May, 2026
You can use dashboard filters to monitor multiple hosts within a single dashboard. You can create a filter based on properties (resource or instance properties) that dynamically update all widgets that meet the defined criteria in the configured filter.
Note: The following widgets dynamically update based on an applied filter:
- Custom Graph
- Gauge
- Table
- NOC
- SLA
- Big Number
- Pie Chart
- Alert list widget
- Map
Map widget only supports property filtering at the resource level (including inherited values), not at the resource group level.
For existing widgets, the filtered hosts are determined by the combination of hosts selected through property filters and those explicitly configured in the widget. If no hosts are found, no data is returned for the filter.
Dashboard filters evaluate resource and instance properties to determine which data they display across supported widgets.
When you apply a filter, the following actions take place:
- Resources and instances that match the defined property criteria are selected
- Widgets update dynamically based on the filtered results
- The final dataset displayed in a widget is the combination of the following:
- Resources defined in the widget configuration
- Resources returned by the applied filter
If no hosts are found, no data is returned for the filter.
Dashboard filters refine, but do not override, widget configuration.
The following describes how filters interact with widget data:
- If a widget has predefined resources, the filter narrows those results
- If a widget relies entirely on dynamic data, the filter determines the full dataset
- If no matching resources are found, no data is displayed
Type of Dashboard Filters
You can use the following types of dashboard filters:
- Private Filters—Configured within in dashboard and apply across multiple dashboards. Private filters do not include default filters, which define a standard filtering view for the dashboard.
- Shared Dashboard Filters—Reusable filters that you can apply across multiple dashboards. They are not tied to a specific dashboard and enable you to use consistent filtering criteria without recreating filters. For more information, see Shared Dashboard Filters.
Default Filters
A default filter is associate with a single dashboard that defines the standard filtering view for a dashboard.
The following characteristics apply to default filters:
- You can set only one default filter per dashboard
- Default filters are cloned when you clone a dashboard
- Default filters persist across dashboard settings views
- You can create and save your own filter variations without modifying the default filter
Default filters help standardize how a dashboard is used and help you identify which property keys are relevant.
Requirements for Creating a Dashboard Filter
To create a default filter view, you need a user with the “Manage” permission for the dashboard that you want to use to create a default filter.
Note: Users that do not have the proper permissions to view properties added to the default filter, do not have access to view the default filter.
Creating a Dashboard Filter
- In LogicMonitor, navigate to Dashboards and locate the dashboard you want to create a filter for.
- In the Filter by field, select
 to add a property filter.
A list of properties is displayed. - In the Filter by field, select an available base property or type a property in the Filter by field.
LogicMonitor displays applicable properties as you type.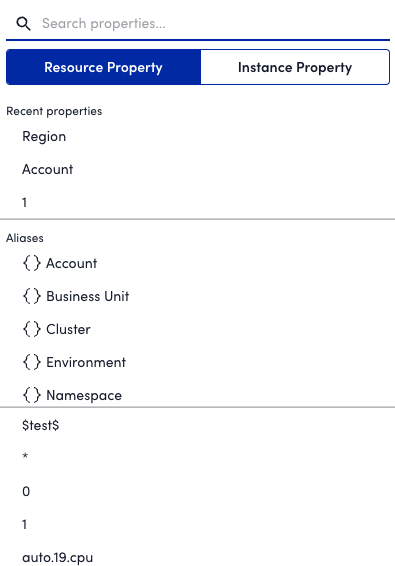
Note: At least one resource property must be added before you can add an instance property. In addition, instance property filters are available only for the following widgets:
-
Custom Graph
Pie Chart (excluding Resource Count)
Gauge
Big Number (excluding Resource Count)
Table
- Type a value for the property in the Search records field, or select a value for the property from the list of values displayed for the property.
LogicMonitor displays applicable values as you type.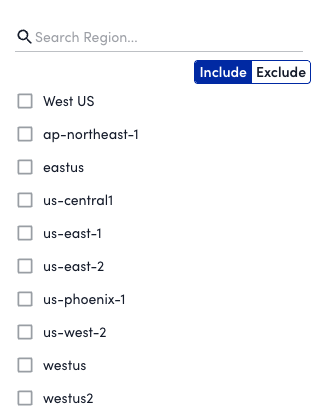
Note: The values are not retained when the filter is saved and shared as the default filter.
- Select whether to include or exclude the value in the filter.
You can select anywhere outside of the filter configuration settings to view the dashboard with the configured filter. The widgets on the dashboard update to display the information defined in the filter. - To save the filter, do the following:
- Select
 Save view.
 - Do one of the following:
- To save as a new filter, enter a name for the filter, and then select Save as new view.
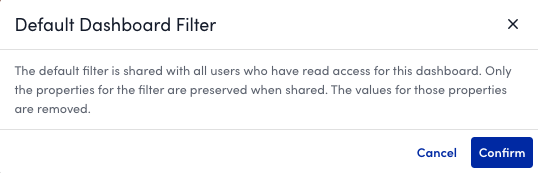
- To create a default filter, select Set as default filter, and then select Confirm when prompted.
- Select
You can repeat this process to add as many resource or instance properties as needed. The widgets on the dashboard update to display the information defined in the filter.
Copying Dashboard URL with Applied Filters
You can copy and share the dashboard URL with applied filters.
Note: The default filter is shared with all users who have read access for this dashboard. Only the properties for the filter are preserved when shared. The values for those properties are removed.
- Log into the LogicMonitor portal and navigate to Dashboards > select the required dashboard.
- On the selected Dashboard, select the required resource properties filter from the Filters drop-down and select Apply.
- On the upper right corner, select Overflow > Copy Dashboard URL.
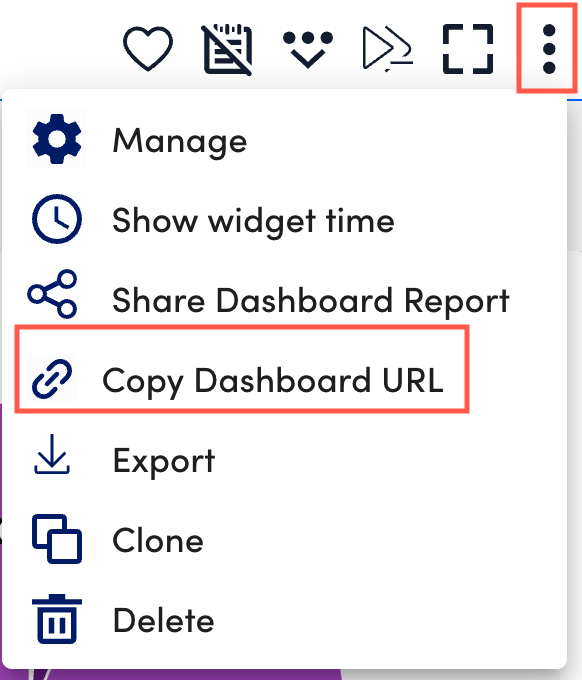
You can share the dashboard URL with or without applied filters. The dashboard URL displays the exact view from when the URL was generated.
Note: The Dashboard URL gets copied with the exact customization and the selected time range.
