Usage Reporting Overview
Last updated on 09 September, 2024You can view the cumulative monthly usage for your organization to help you understand how and where your environment is incurring the most data usage. You can view this information directly in your LogicMonitor portal.
Note: All the usage metrics and time stamps are displayed in Coordinated Universal Time (UTC).
The Usage page displays metrics for each LogicMonitor product (for example, LM Logs) that you are licensed to use. You can select the product to view the applicable metrics, and view those metrics for the current month and previous months.
If your environment provides services for multiple LogicMonitor accounts, you can view usage data for the following types of contributors:
- Child accounts—View the usage for your accounts if your accounts are kept in separate LogicMonitor portals
- Tenant Identifier—View the usage for your accounts if you organize your accounts in the same LogicMonitor portal using the Tenant Identifier property
For more information, see Tenant Identifier Property Name.
Based on the product you select, LogicMonitor displays information regarding your current usage and committed value. If you are at risk of running out of your committed amount, LogicMonitor predicts when you will run out of your committed amount and what the overage will be at the end of the month based on your current usage. This predication allows you to make adjustments as necessary. If you run out of your committed amount before the end of the month, LogicMonitor predicts the overage based on your current usage.

Note: Metrics are gathered hourly and reported daily.
Visual Components for Usage Reporting
The Usage page uses the following visual components to display your usage data for the available products:
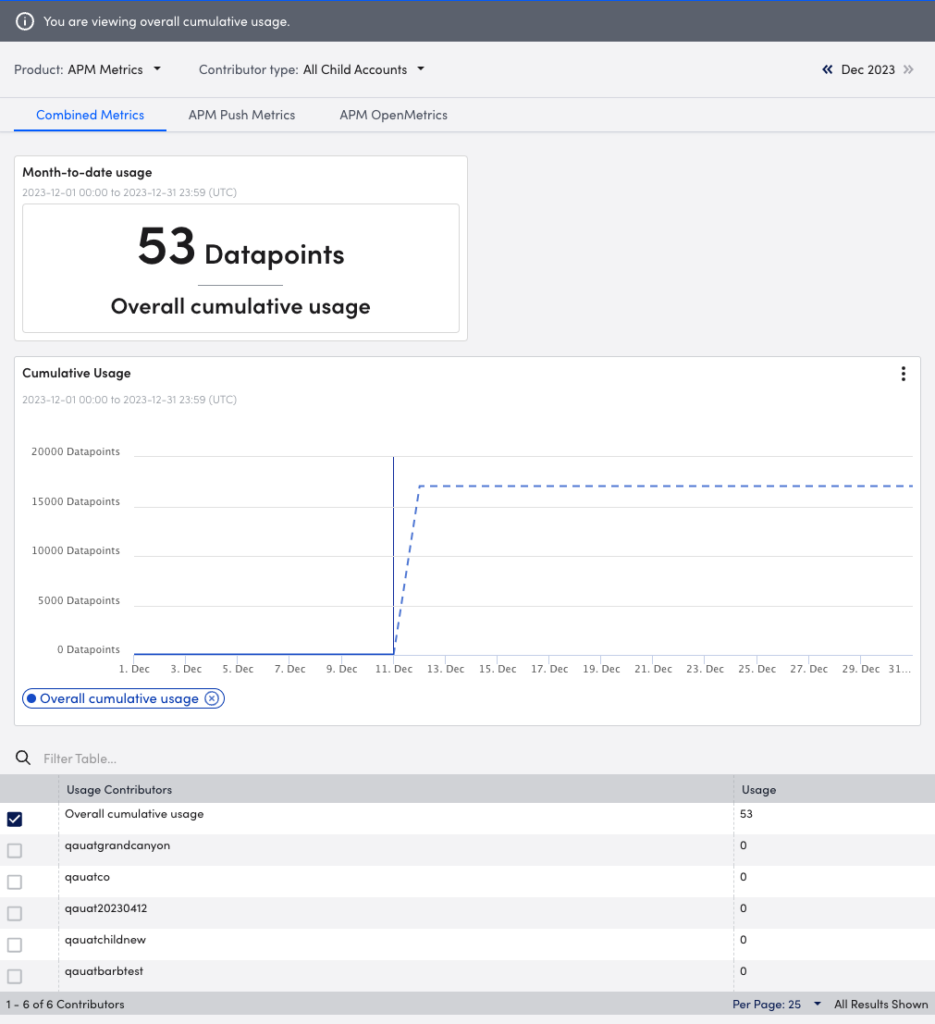
- Month-to-date usage summary—This visual provides you a month-to-date summary of the total cumulative usage for your selected product, as well as the percentage used of your committed amount.

- Cumulative Usage graph—When the current calendar month is selected, you can view the cumulative usage for the month in a sparkline graph or bar graph format. In addition, LogicMonitor can forecast your usage for your selected product based on your current usage trends for the current month. Hovering over the graph provides you with the usage metrics for a specific date. The graph dynamically updates based on the product you select.


Note: The Cumulative Usage graph does not display data on the first of the month.
- Usage Contributors table—If your environment provides services for multiple LogicMonitor accounts, selecting “All child accounts” as the contributor displays a table listing each account with the corresponding usage data for that account. You can select a child account from the table to display both the child account’s cumulative usage data and your total cumulative usage data in the Cumulative Usage graph. In addition, the Month-to-date usage summary updates to reflect the usage of the selected child account.

Selecting a different month dynamically updates the metrics to reflect the month selected.
Note: Some products display additional visual components to convey more in-depth usage information for that product. For more information, see the applicable documentation for each product LogicMonitor gathers usage metrics for.
Usage per Product
The following table displays the products that LogicMonitor provides Usage metrics for and how that data is calculated:
| Product | Calculation |
| APM Metrics | Number of Push Metric and OpenMetric datapoints that you define within the PushModules For more information, see Getting Started with Push Metrics and OpenMetrics Monitoring. |
| LM Logs | Total data volume sent to LogicMonitor based on monthly aggregation For more information, see LM Logs usage Monitoring. |
| SaaS Monitoring | Rolling average of your daily usage Your bill is determined by the billing unit listed in your contract (number of Users or Services). For additional details, contact Support. |
| IaaS Monitoring | Monthly average count of cloud VMs (AWS EC2, Azure Virtual Machines, Azure Virtual Machine Scale Sets VM, GCP Compute Engine instances). Each IaaS resource includes 10 Non-compute monitored cloud resources. Non-compute resource counts are also calculated on a monthly average. Non-compute resources are supported cloud services that are not counted as IaaS or PaaS resources. For more information, see Cloud Services and Resource Units. |
| PaaS Monitoring | Monthly average count of monitored PaaS cloud resources. The average number of monthly monitored Kubernetes Pods are included in the PaaS monitoring count. For more information, see Cloud Services and Resource Units. |
| APM Synthetics | Total data volume sent to LogicMonitor based on monthly aggregation. For more information see, Usage Reporting for APM Synthetics. |
| APM Traces | Total data volume sent to LogicMonitor based on monthly aggregation. For more information see, Usage Reporting for APM Traces. |
General Requirements for Viewing Usage Metrics
To access Usage Reporting, you need a LogicMonitor user with the “Usage” permission set. For more information, see Users and Roles.
To view the usage based on tenant identifier, you must have a property configured for the Tenant Identifier. For more information, see Tenant Identifier Property Name.
