Creating & Managing Reports
Last updated - 25 July, 2025
Overview
LogicMonitor has built-in reports that you can use to review key information for alerts; monitored data; device, website, and cloud resource configurations; dashboards; and user accounts and roles. Alert reports are a less disruptive way of monitoring non-critical issues as compared to email, text, or voice alert notifications.
Creating Reports
To create a report:
- Select Reports | Add | Report.
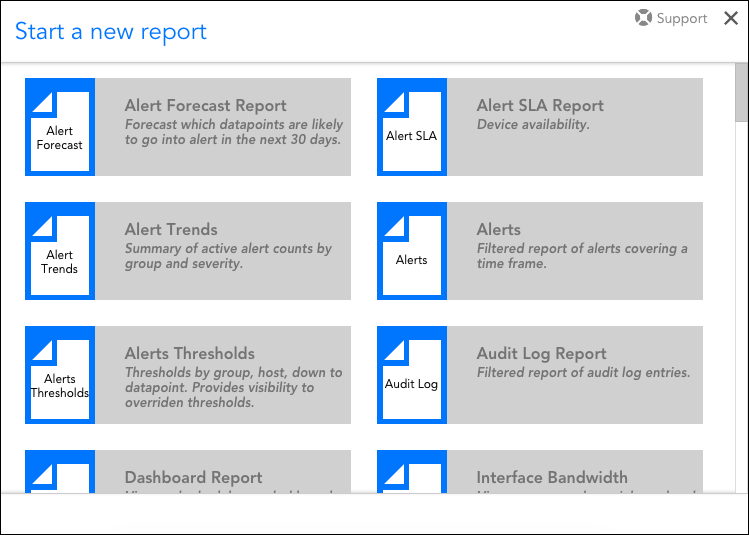
- Scroll through the Start a new report dialog to select the type of report you’d like to create. There are more than 15 types of reports available; to determine the best type of report for your purpose, see Which report should I use?.

- Configure the settings that are universal to all report types. These include:
- Title. Enter the name of your new report. Report names cannot include the operators and comparison functions used in LogicMonitor’s datapoint expression syntax, as discussed in Complex Datapoints.
- Description. Enter a description for your new report.
- Group. From the Group field’s dropdown menu, select the folder, if any, you’d like to store your report in. For more information on report groups, see Creating a Report Group.
- Format. Select the report’s output format: HTML (limited to 100,000 generated line items), CSV (limited to 500,000 generated line items) or PDF (limited to 4000 generated line items).
- Generate this report on a schedule. Select the Generate this report on a schedule checkbox to enable recurring generation and emailing of the report. For more information on scheduling reports, see Scheduling a Report for Auto-Delivery.
Note: Upon configuring or editing a delivery schedule, your report will be generated and emailed immediately, assuming it has not been generated within the last 24 hours. After that, emailed delivery will only occur according to the schedule.
Note: A configured maximum value of DataSource instances can require report delivery. If this maximum value is exceeded, a text box prompt will appear for the user to enter email addresses for report delivery, to avoid display delay rather than attempting report viewing.
- Complete the configurations that are unique to the report type you are creating. For details on completing configurations unique to a specific report type, see its dedicated support article.
- Click Next to save the new report and its parameters.
- Upon clicking Next, you’re presented with the option of running your new report to review its output.
Report Limits
In addition to the line item limits specified in the previous section for the different report formats, there are limits for:
- Output size. These limits vary per report based on how complex the query is on the backend, but are generally quite liberal. For example, the Resource Metric Trends report and the Interface Bandwidth report support outputs for up to 5,000 instances. You will receive a warning if the resources or groups included in your report’s parameters should exceed maximum size.
- Alerts and audit log entries. The number of alerts and audit log entries that can be included in a report is subject to the retention defined in your service agreement.
Using the Reports Page

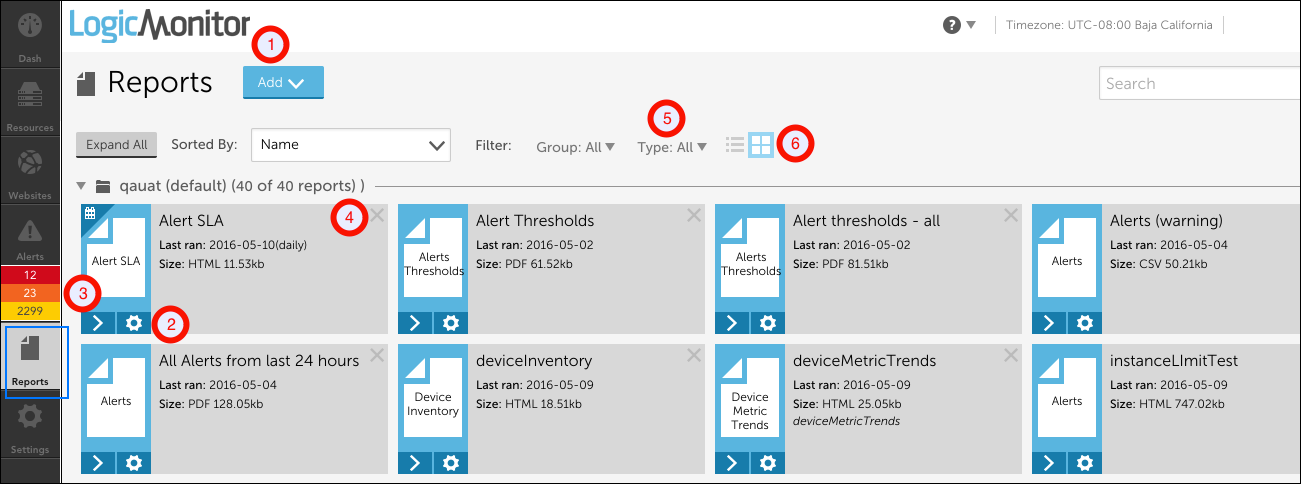
As labeled in the previous screenshot, you can perform the following functions from the Reports page:
- Create reports and report groups
- Edit a report
- Run a report
- Delete a report
- Filter and sort displayed reports
- Choose a tile or lists reports view
Viewing Reports
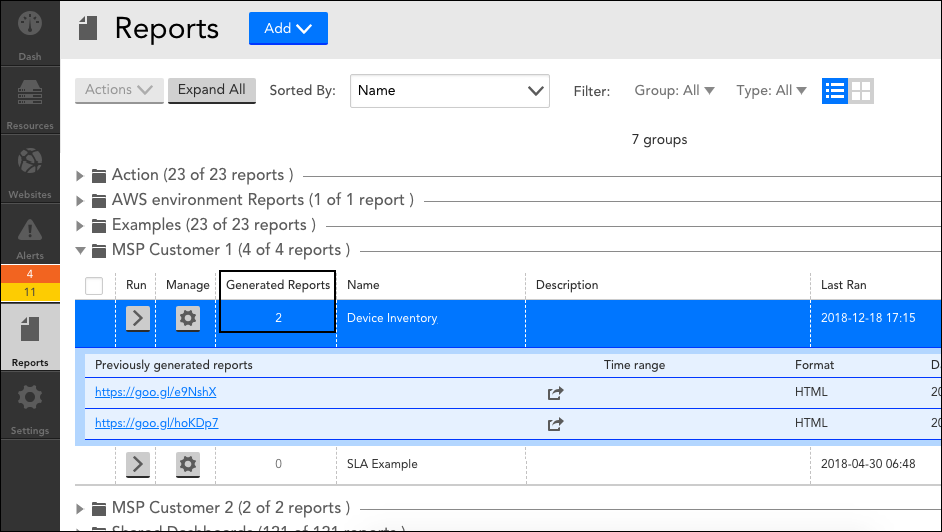
Once a Report is created and saved, you can view its output history from the Reports page.
In the list view, click the number displayed under “Generated Reports” for the report. This number represents the number of times the report was run in the last 7 days.
The row expands to display a table listing past iterations of the report, with options to view, share the URL, or delete a generated report.


