
Accessing LogAnalysis
Last updated - 11 November, 2025
After you start a LogAnalysis session, all the logs are ingested and analyzed in the session. Each LogAnalysis session is saved for 24 hours after it starts. You can share the LogAnalysis session with other users.
You can access the LogAnalysis feature using the following:
- From the LM Logs page to view query results in LogAnalysis
- From the LM Alerts detail pane
- From the Resource and Resource Group columns in the LM Logs page to view logs associated with those resources/groups in LogAnalysis
To start and access the LogAnalysis from the Logs page, do the following:
- In LogicMonitor navigation menu, select Logs.
- On the Logs page, select LogAnalysis.
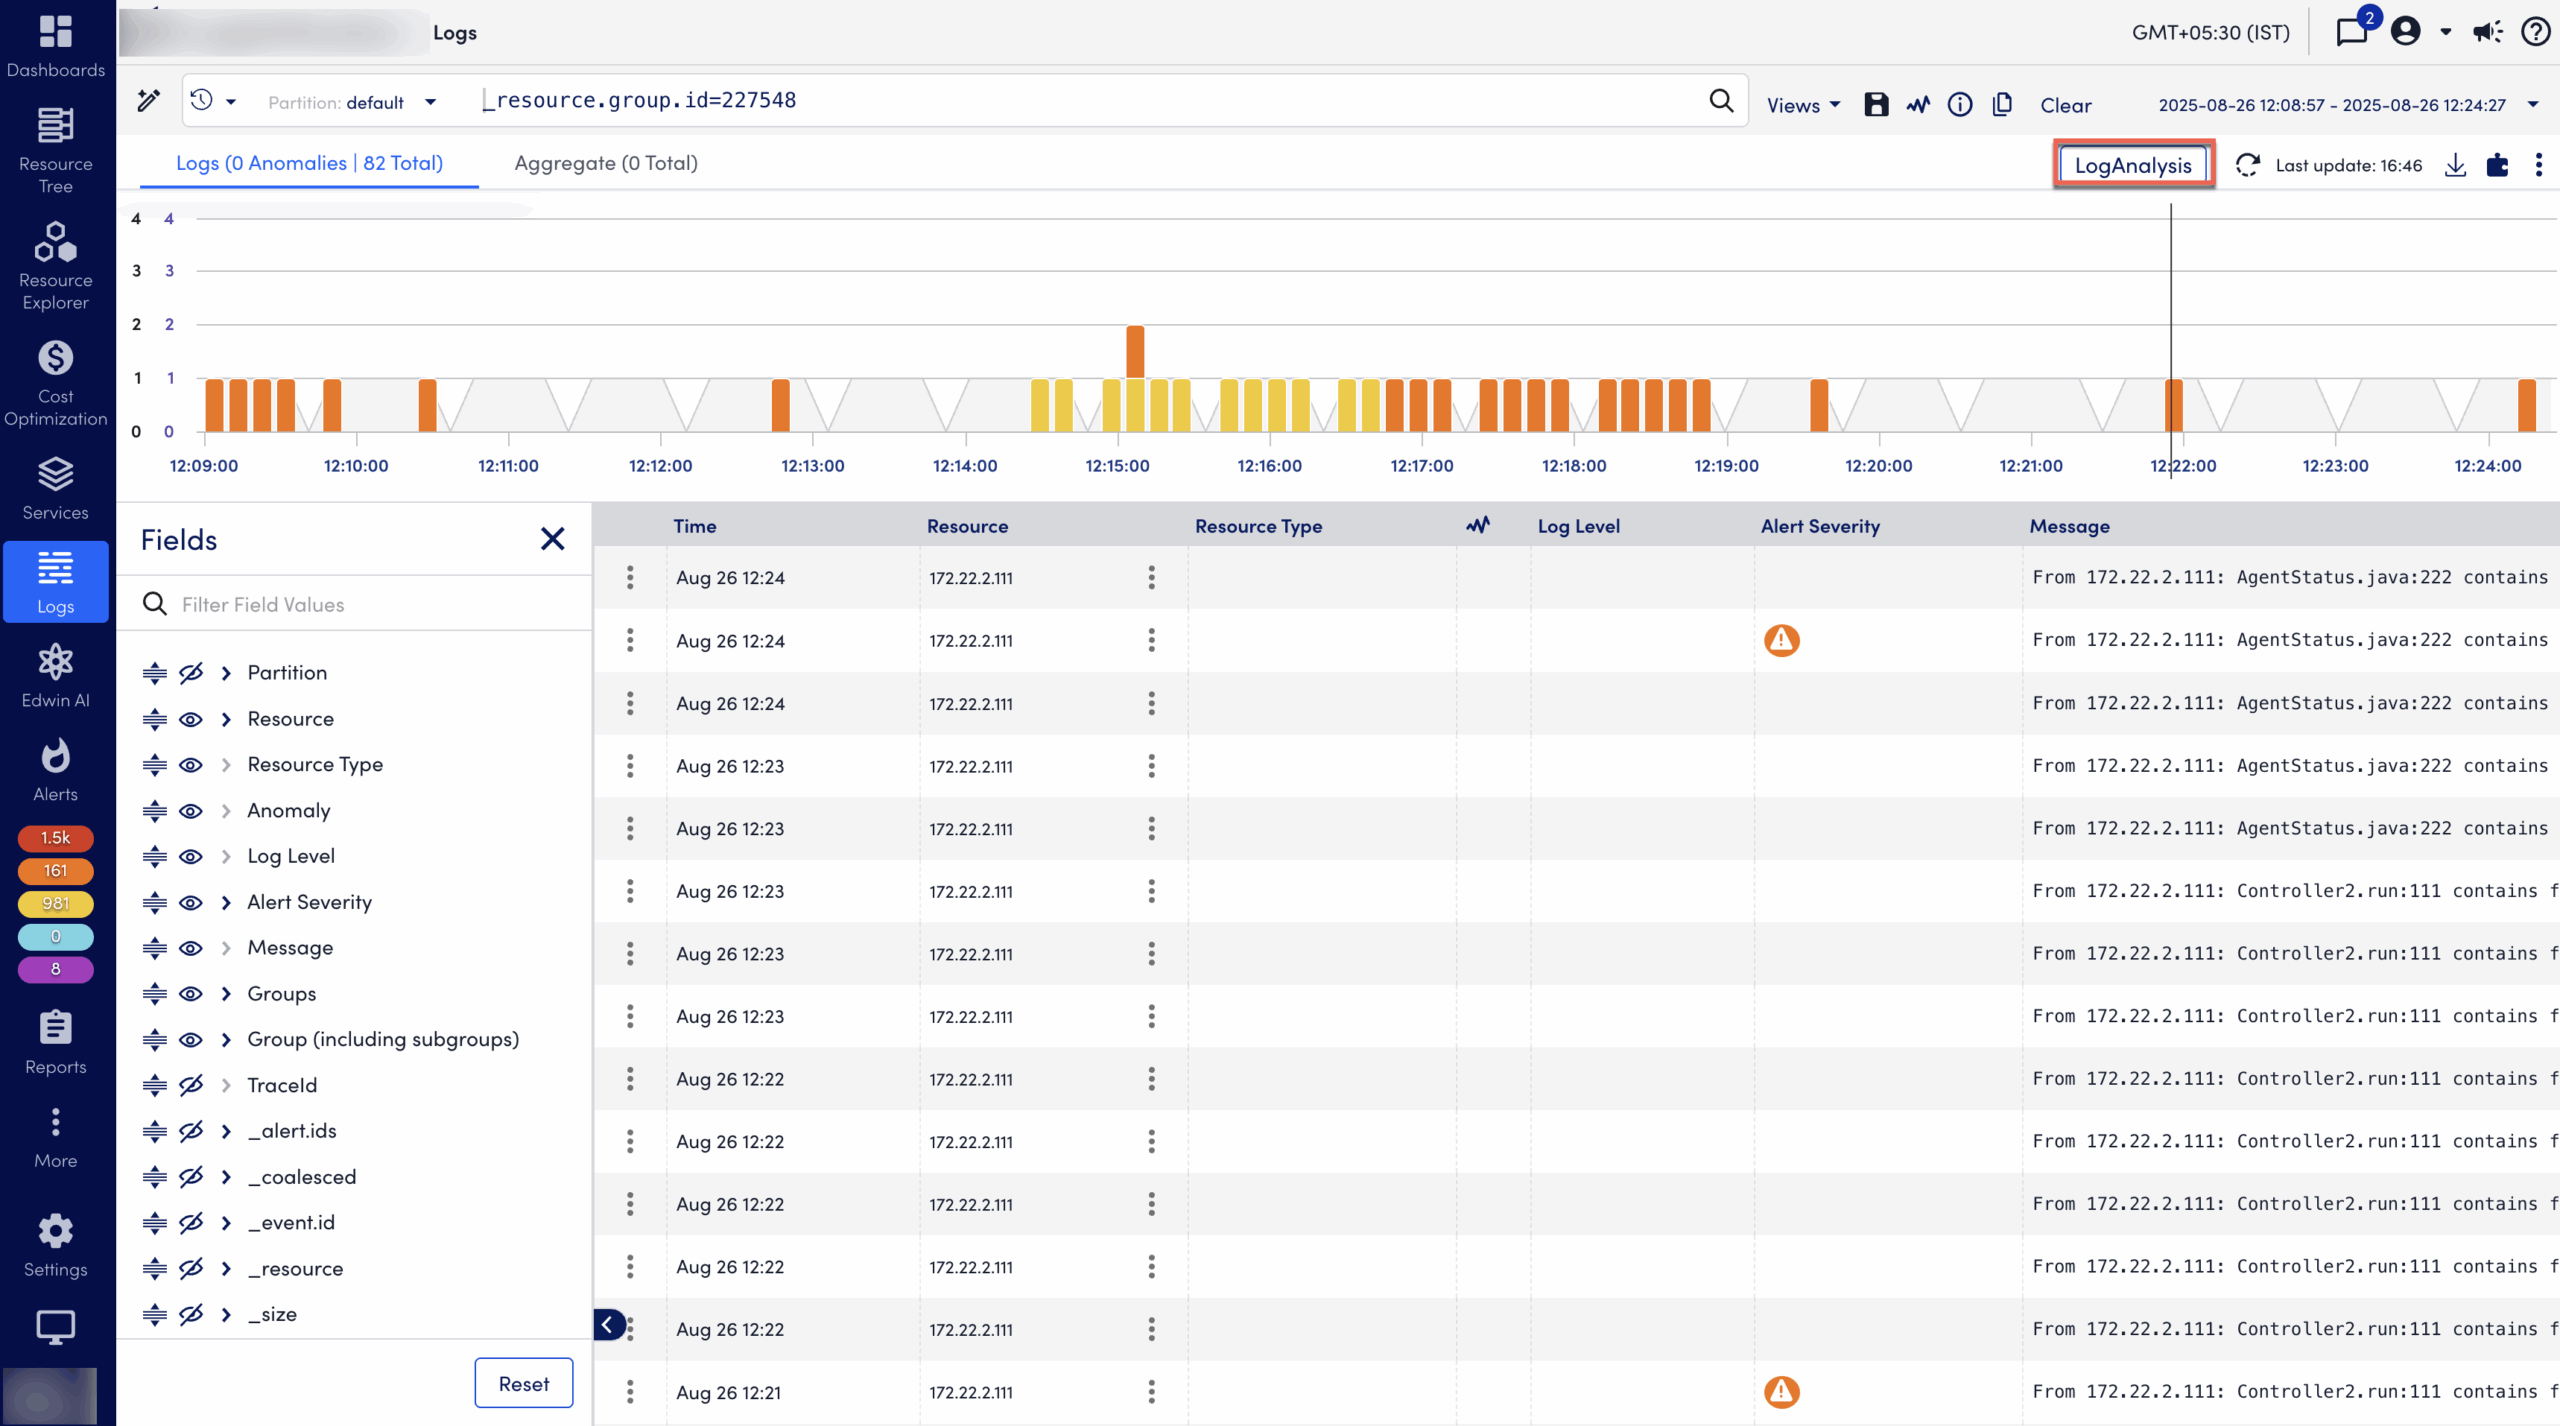
Note: In each LogAnalysis session a maximum of 100,000 log messages or 1 weeks worth of logs can be analyzed. If there are more than 100,000 log messages or time range is greater than 1 week, the LogAnalysis button becomes unavailable.
To access LogAnalysis from the Alerts page, do the following:
- In LogicMonitor navigation menu, select Alerts.
- Select any alert from the Alerts page.
- Select the Logs tab.
- Select LogAnalysis.
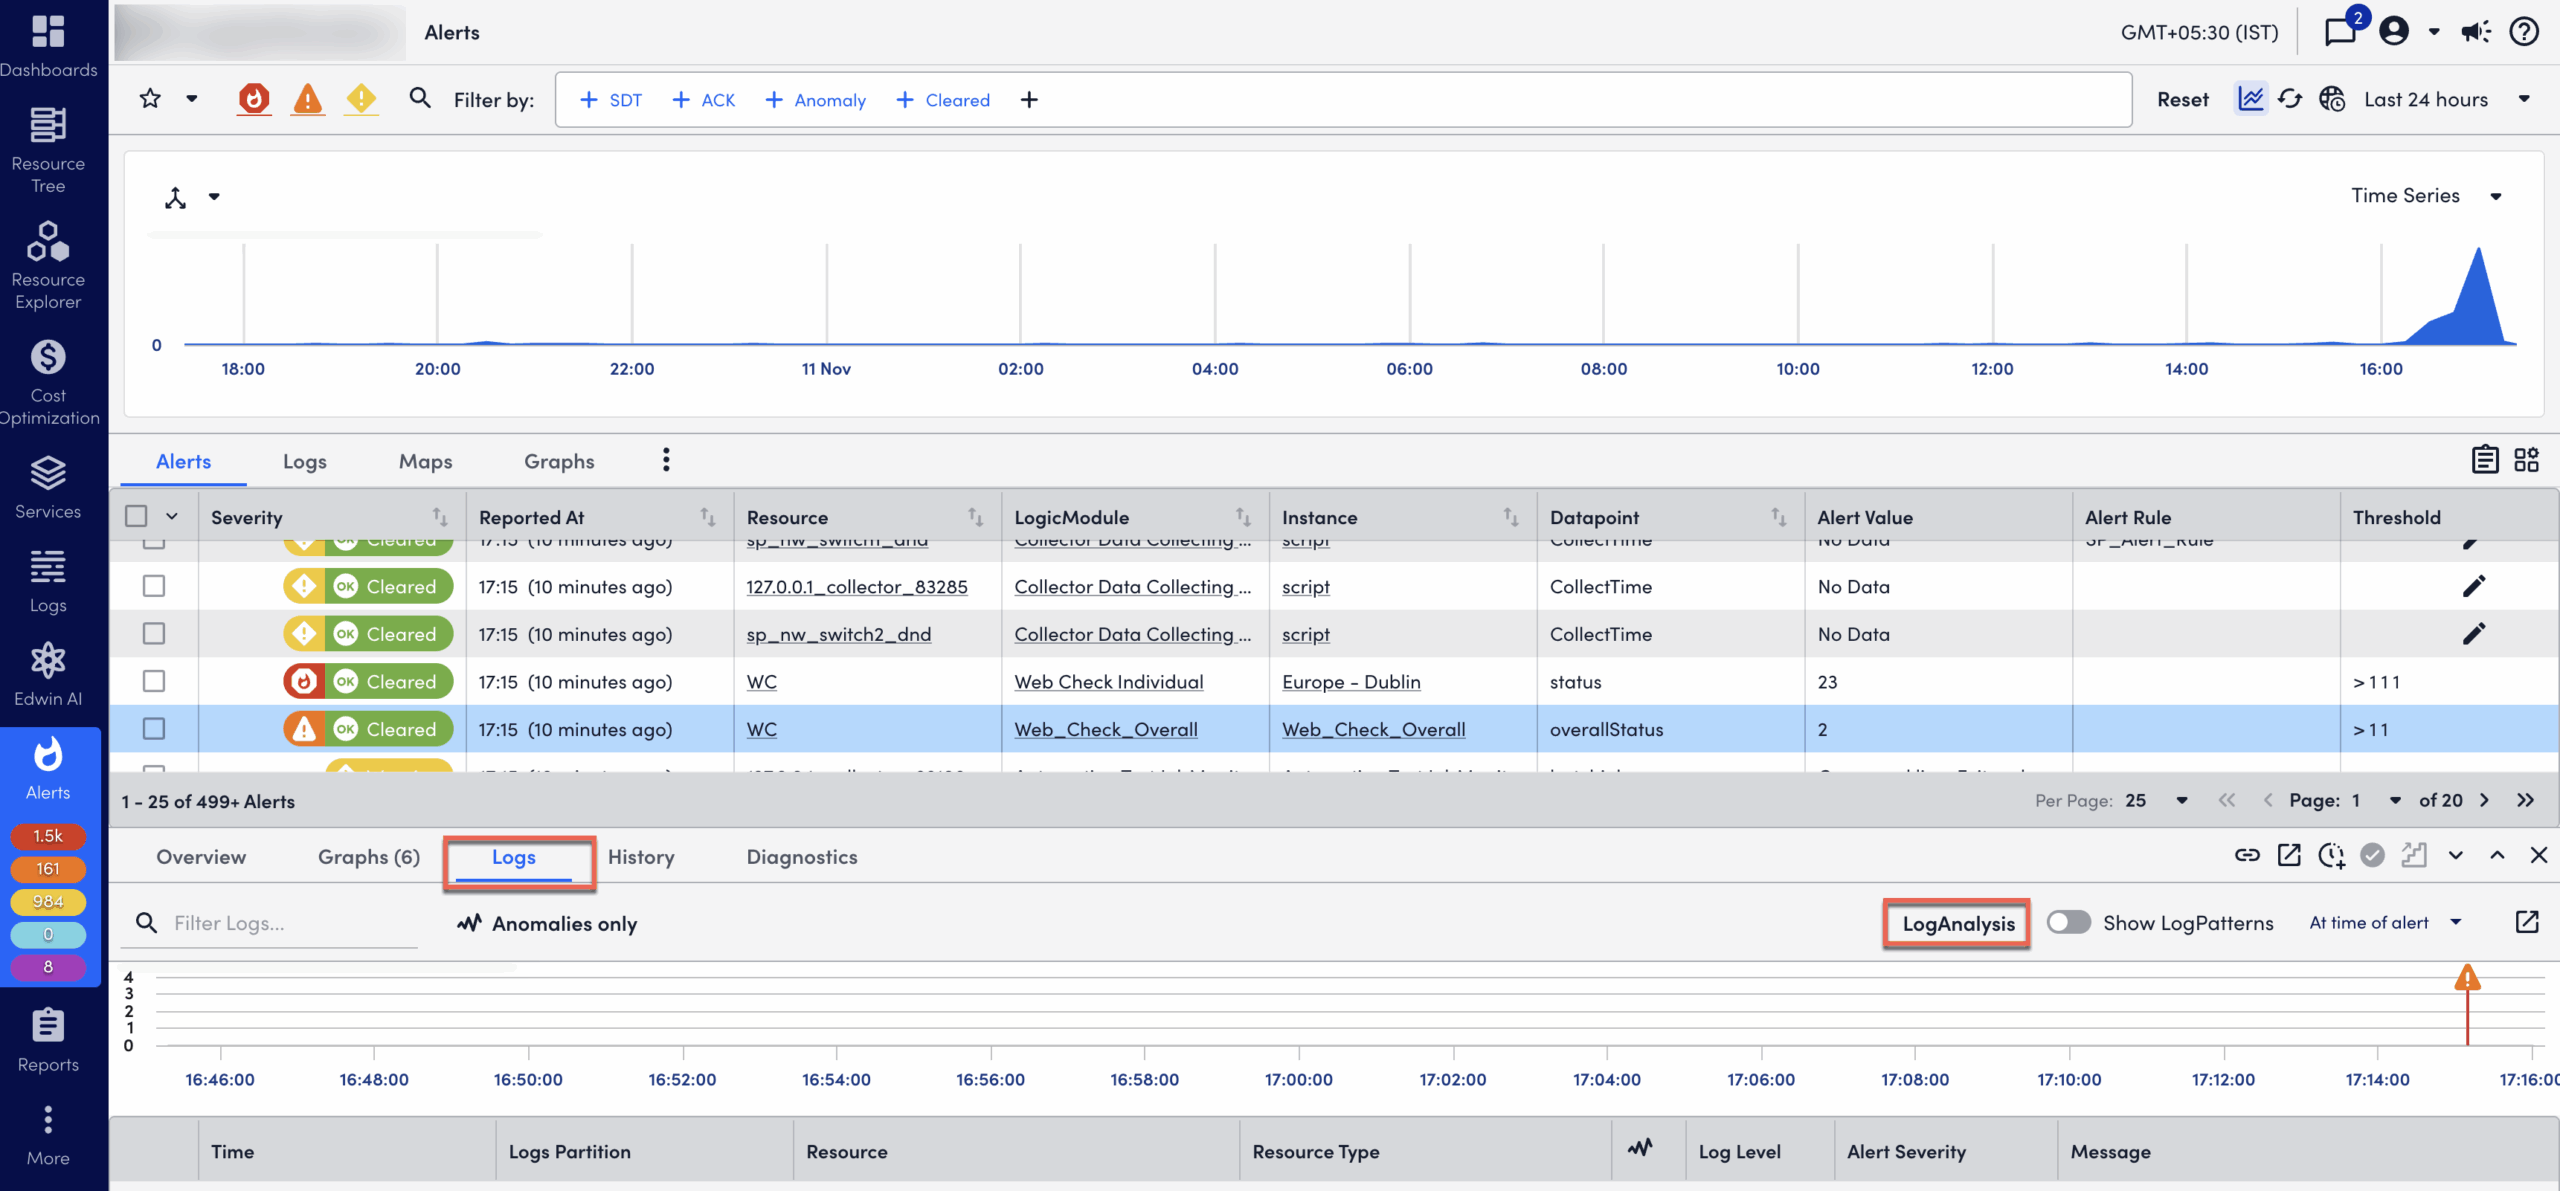
Note: This will generate a query that is 30 minutes before and after the alert timestamp for the given resource. In the event that this time range generates a data set that is larger then the maximum allowed number of log messages:
- The time range will be shrunk by a configured size until it falls below this threshold.
- The number of logs will be shrunk up to 5 times before displaying a “Too Large” error.
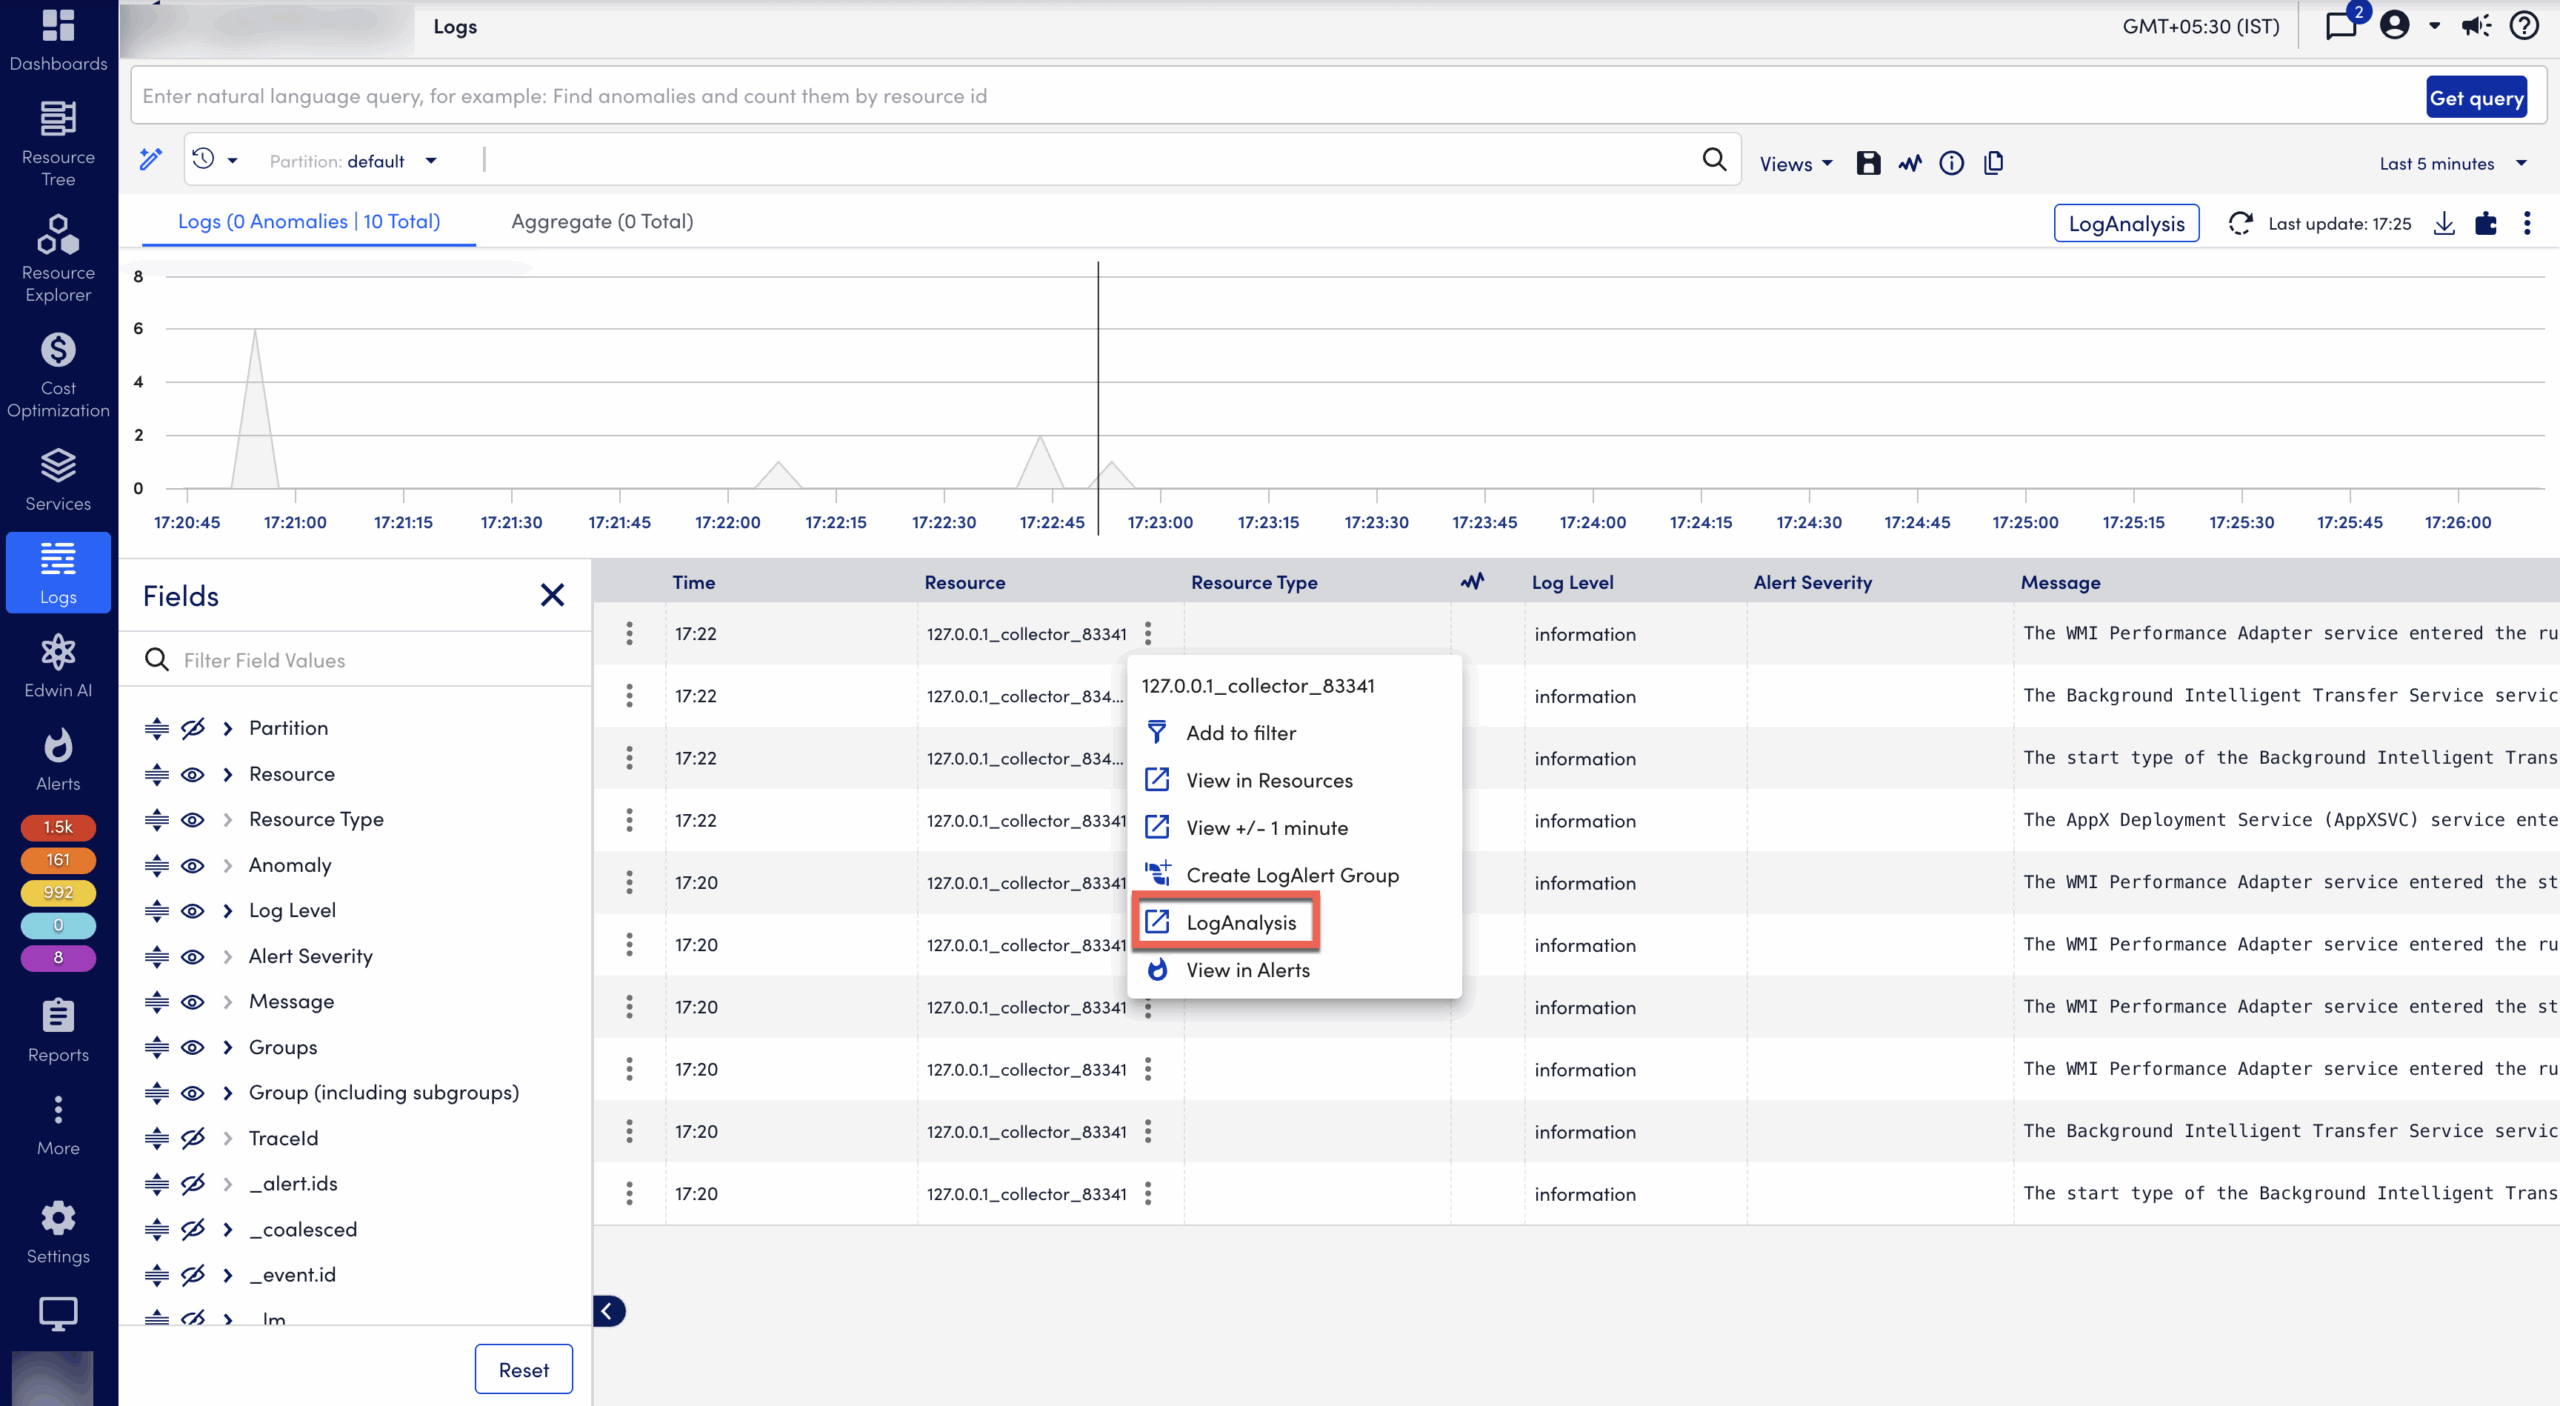
To access LogAnalysis from the Resources and Resource groups columns on the Logs page, do the following:
- In LogicMonitor navigation menu, select Logs.
- On the Logs page, from the Resources column, select the More options menu, and select LogAnalysis.
Related topics:
