Filtering Logs using LogAnalysis
Last updated - 10 November, 2025
Use filtering to narrow down logs by including or excluding values of a dimension. These actions will add an items to the filter.
You can filter the logs as follows:
- From your LogAnalysis session, select a dimension from the pie chart, and then select Include or Exclude the selected dimension. This includes or excludes only the selected dimension in the filter section.

- To apply a filter from the widget menu, select the widget menu and then select Include selected in filter or Exclude selected in filter. This includes or excludes all the dimensions from the selected widget to the filter section.

- From the filter section, select Submit to apply the filters on the logs, else select Reset to remove applied filters and also to reset zoom in.
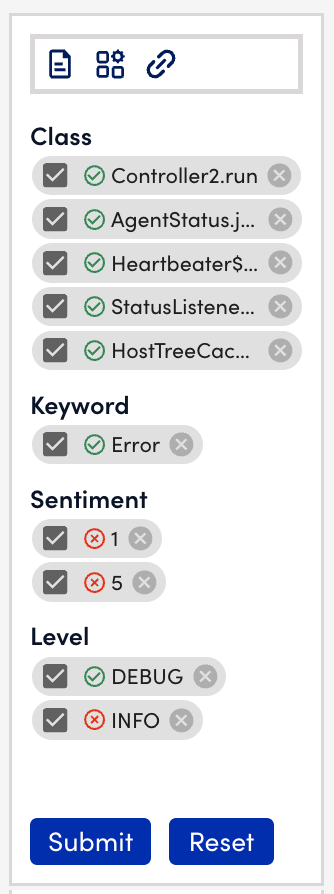
Note: Each filter option can be toggled on or off or deleted from the list. A green check indicates the value will be included in the log query, and the red x indicates that it will be excluded from the log query.
Filtering Logs using Negative Phrases
You can filter logs using negative phrases. The filter result displays only the logs that match the negative phrases or keywords.
To filter logs using negative phrases, from your LogAnalysis session, do the following:
- Select a dimension from pie chart, and then select Show Negative Phrases.

This displays negative phrases for the selected dimension.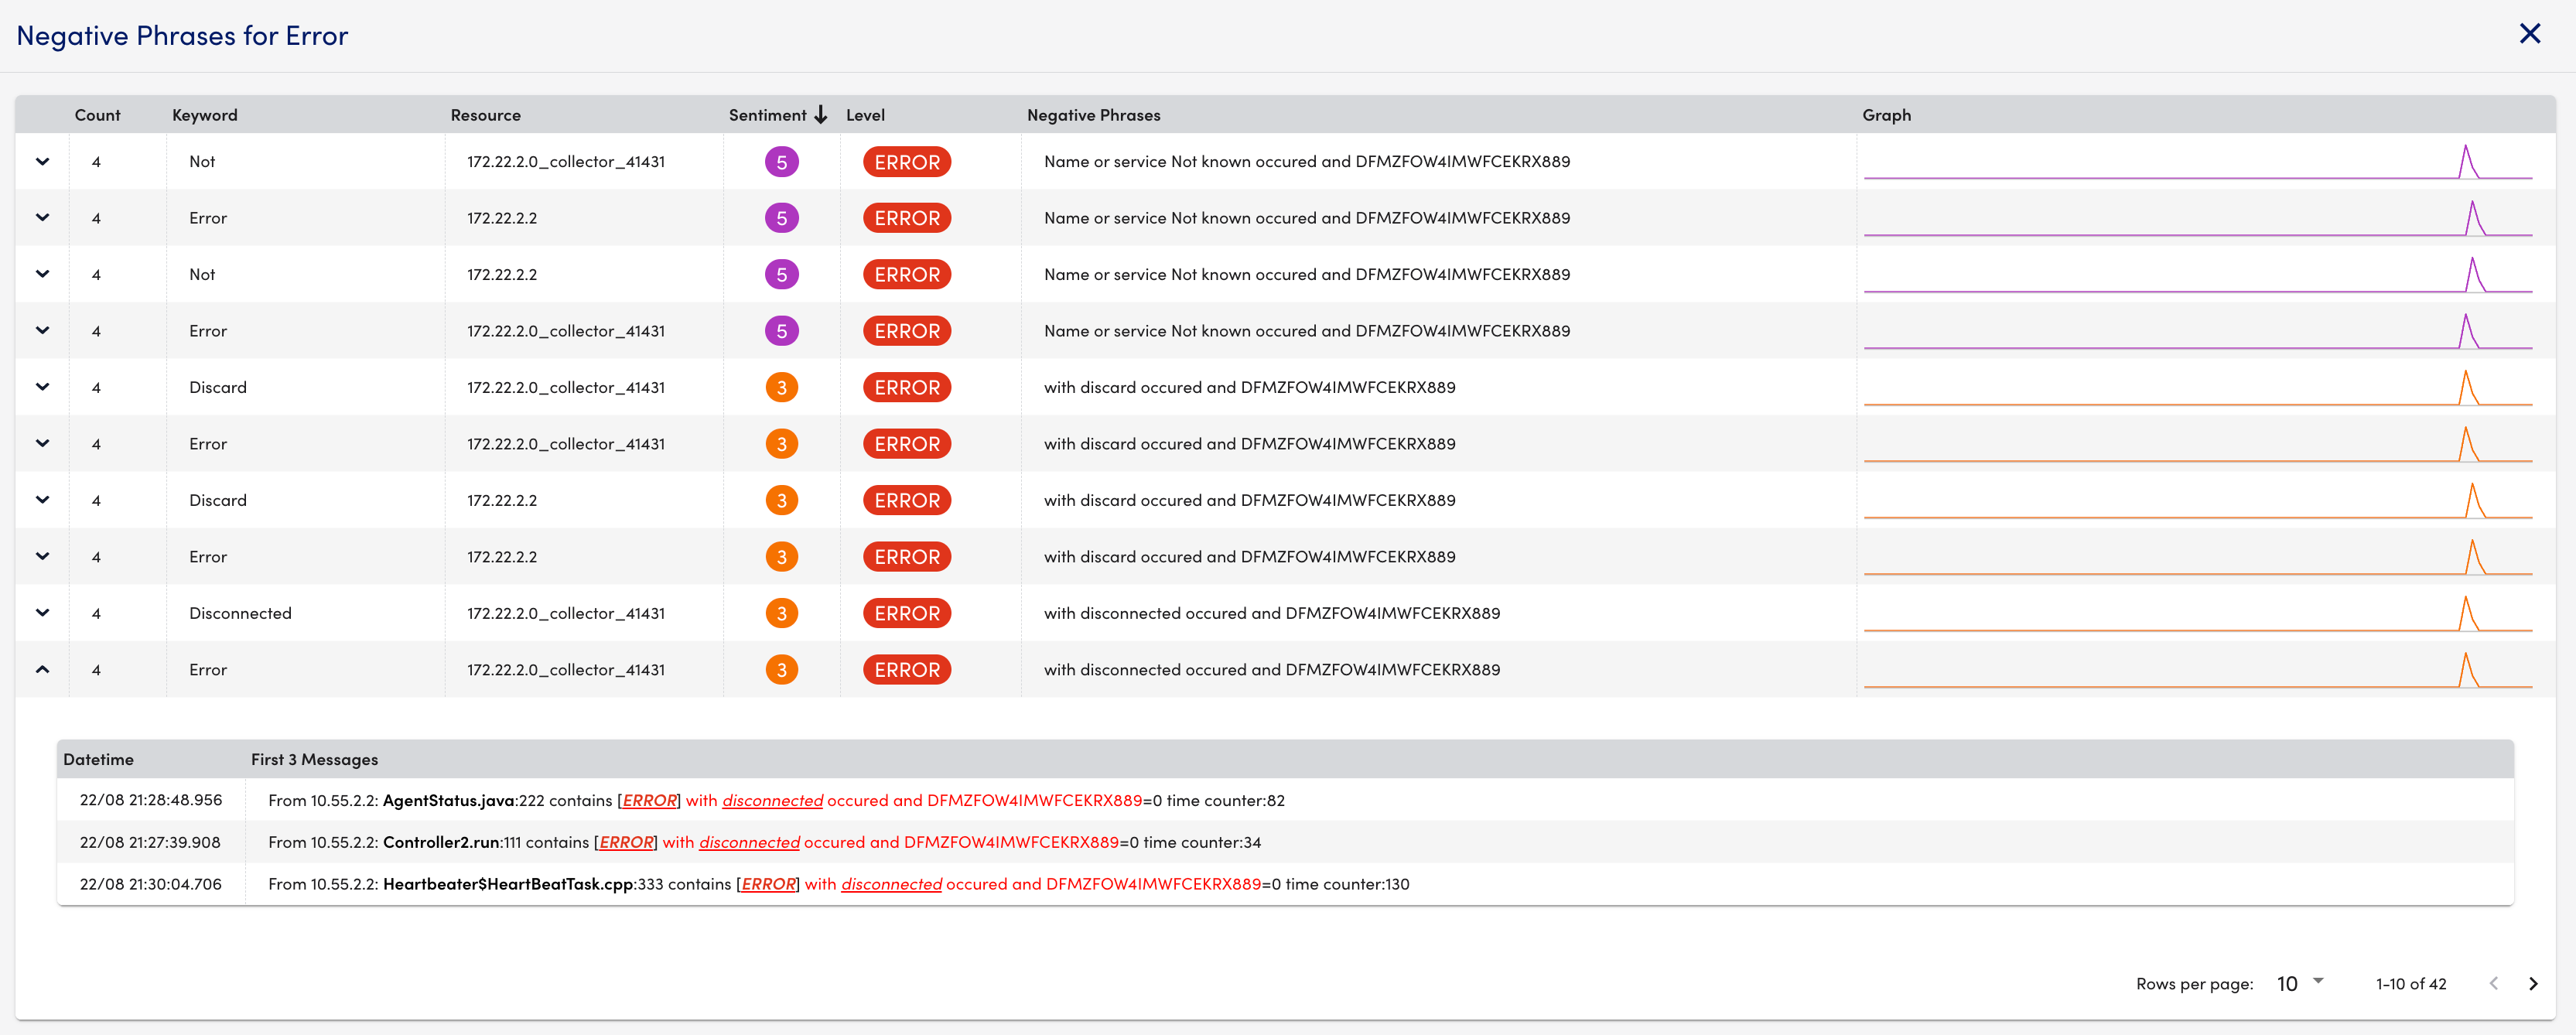
- Select the widget menu and then select Show Negative Phrases.

This displays negative phrases for the selected widget.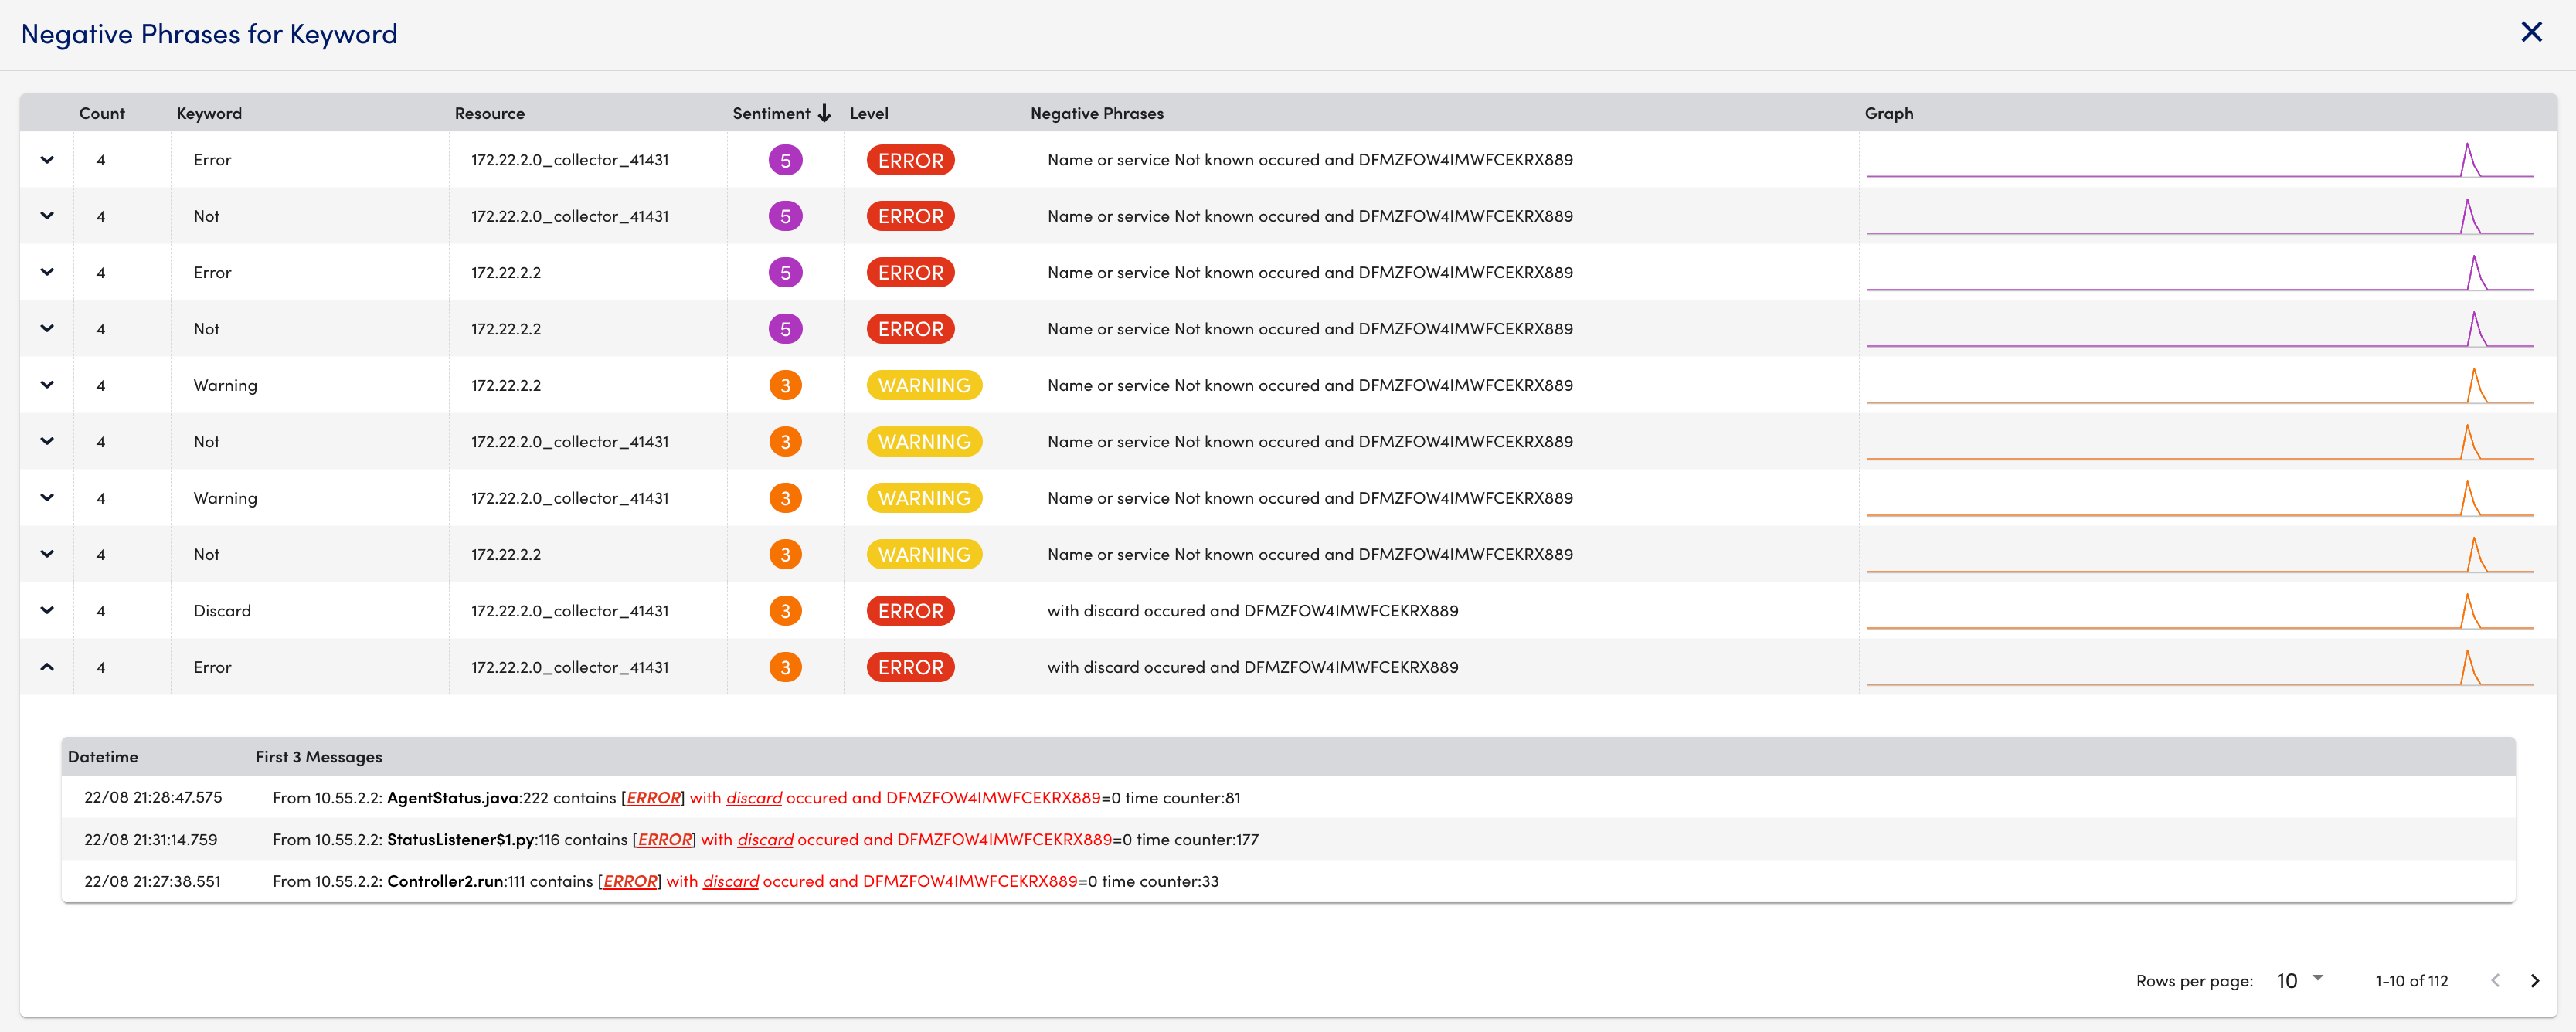
- From the filter section, select Negative Phrases.
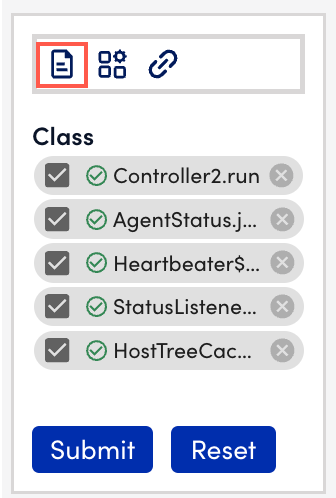
This displays negative phrases for the entire LogAnalysis session.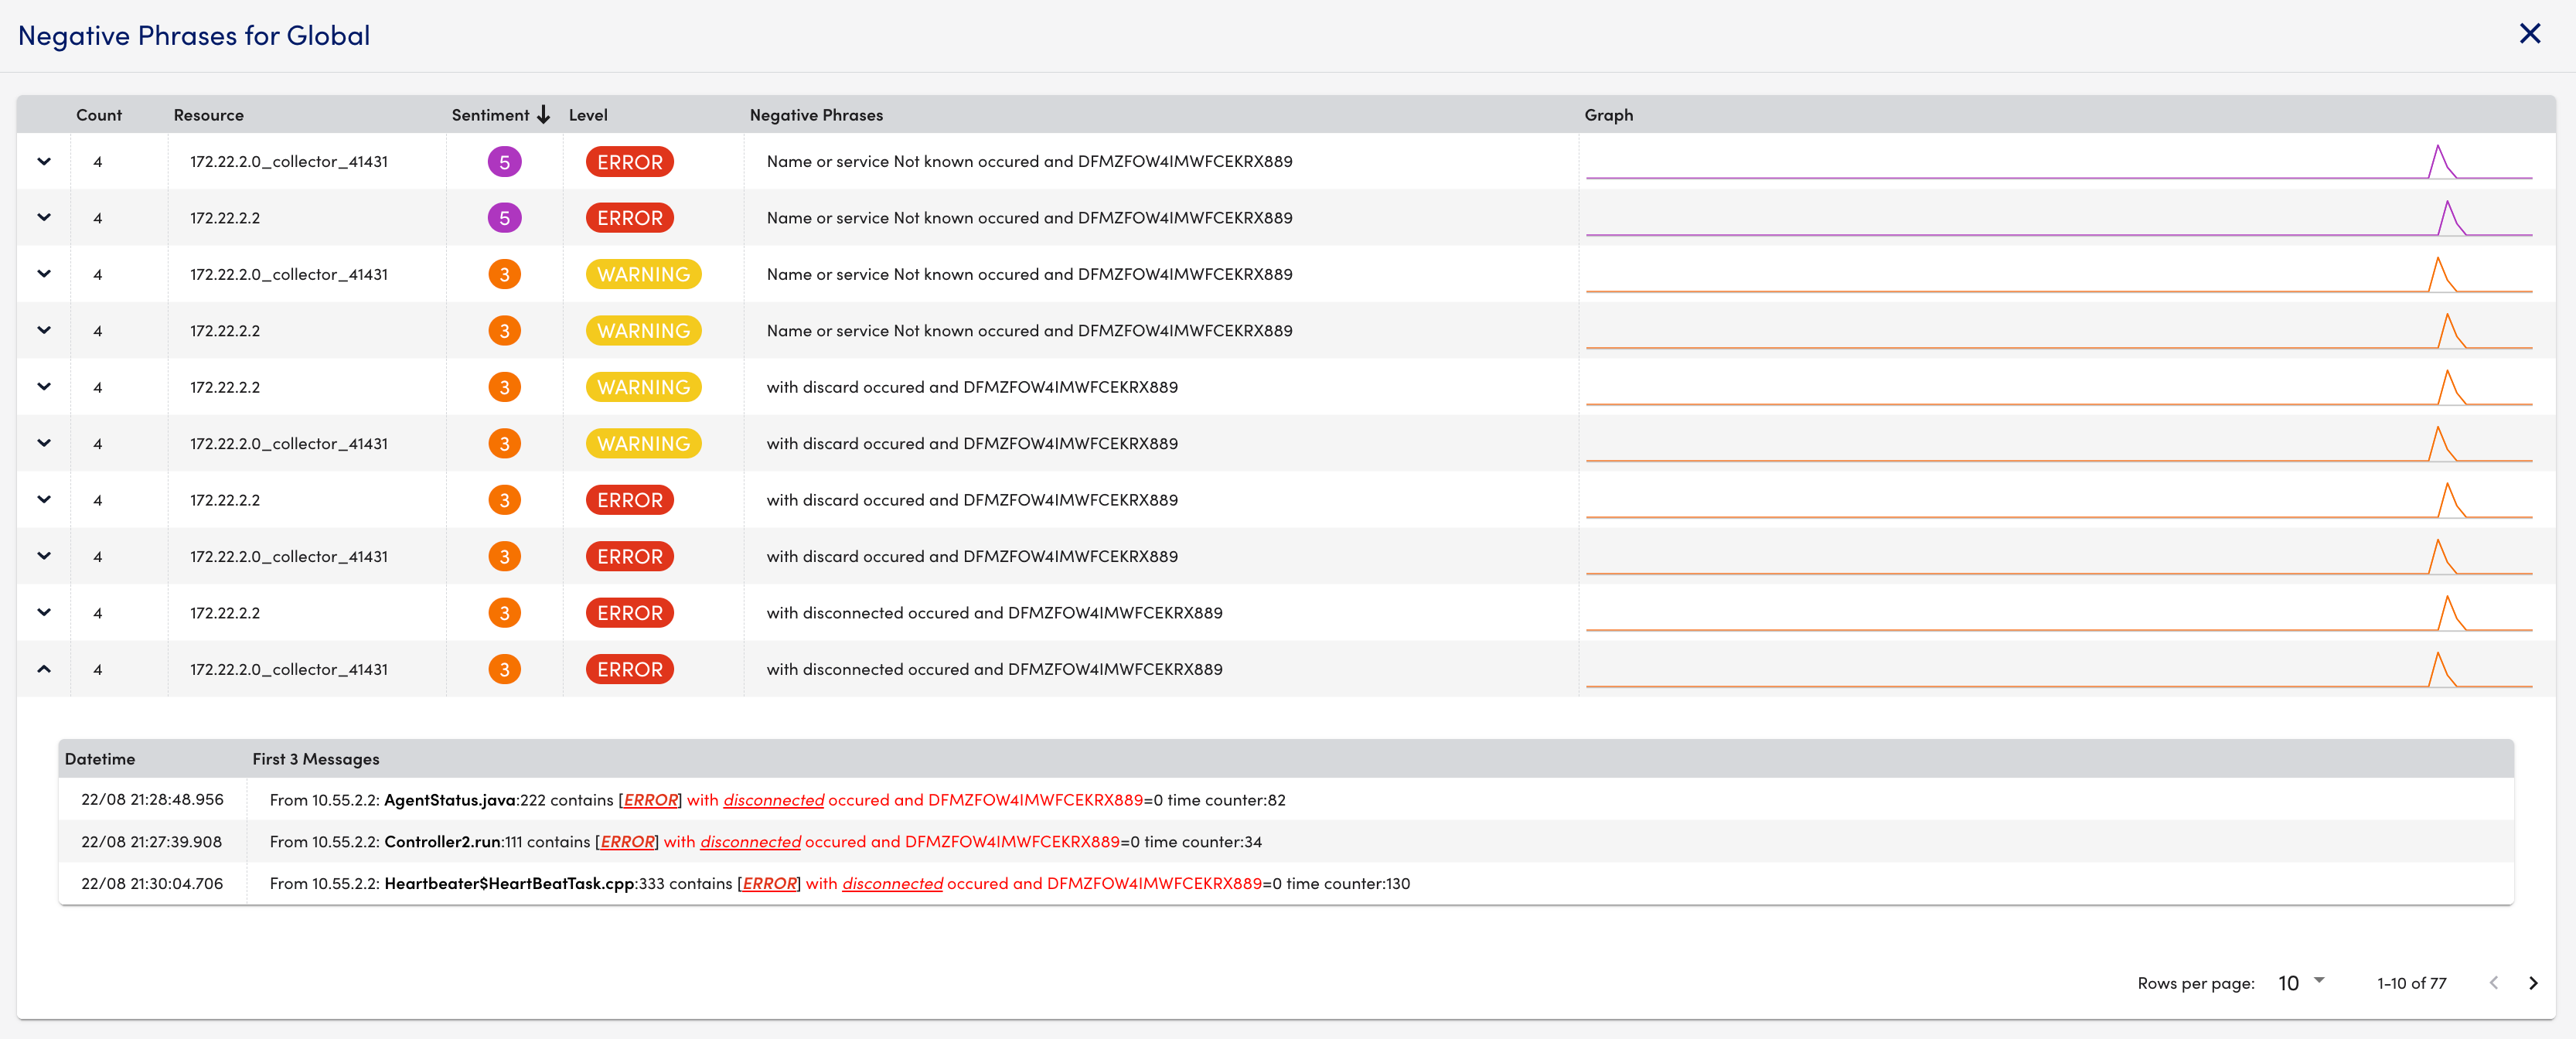
Related Topics:


