
LogAnalysis
Last updated - 11 November, 2025
LogAnalysis simplifies and visually enhances the inspection of logs and elevates awareness of potential problems within logs to reduce the amount of time needed to troubleshoot and the amount of expertise required by teams. It generates a sentiment around specific logs (based on keywords) and uses those keywords to identify potentially negative phrases, accelerating the identification of impactful log messages. It can be extended with flexible user dimensions to surface what’s most important to your organization, and it can help those with less domain experience understand the importance or urgency of complex messages output by today’s hybrid technology stacks.
Use LogAnalysis to view and filter important log messages. LogAnalysis makes it easier to search specific log messages without needing domain knowledge to write an advanced query. You can review critical log messages with just a few clicks. When you start a LogAnalysis session, all the log messages are ingested and analyzed in the session.
The LogAnalysis page includes widgets, a filter section, and a logs table. For more information, refer to the following illustration:
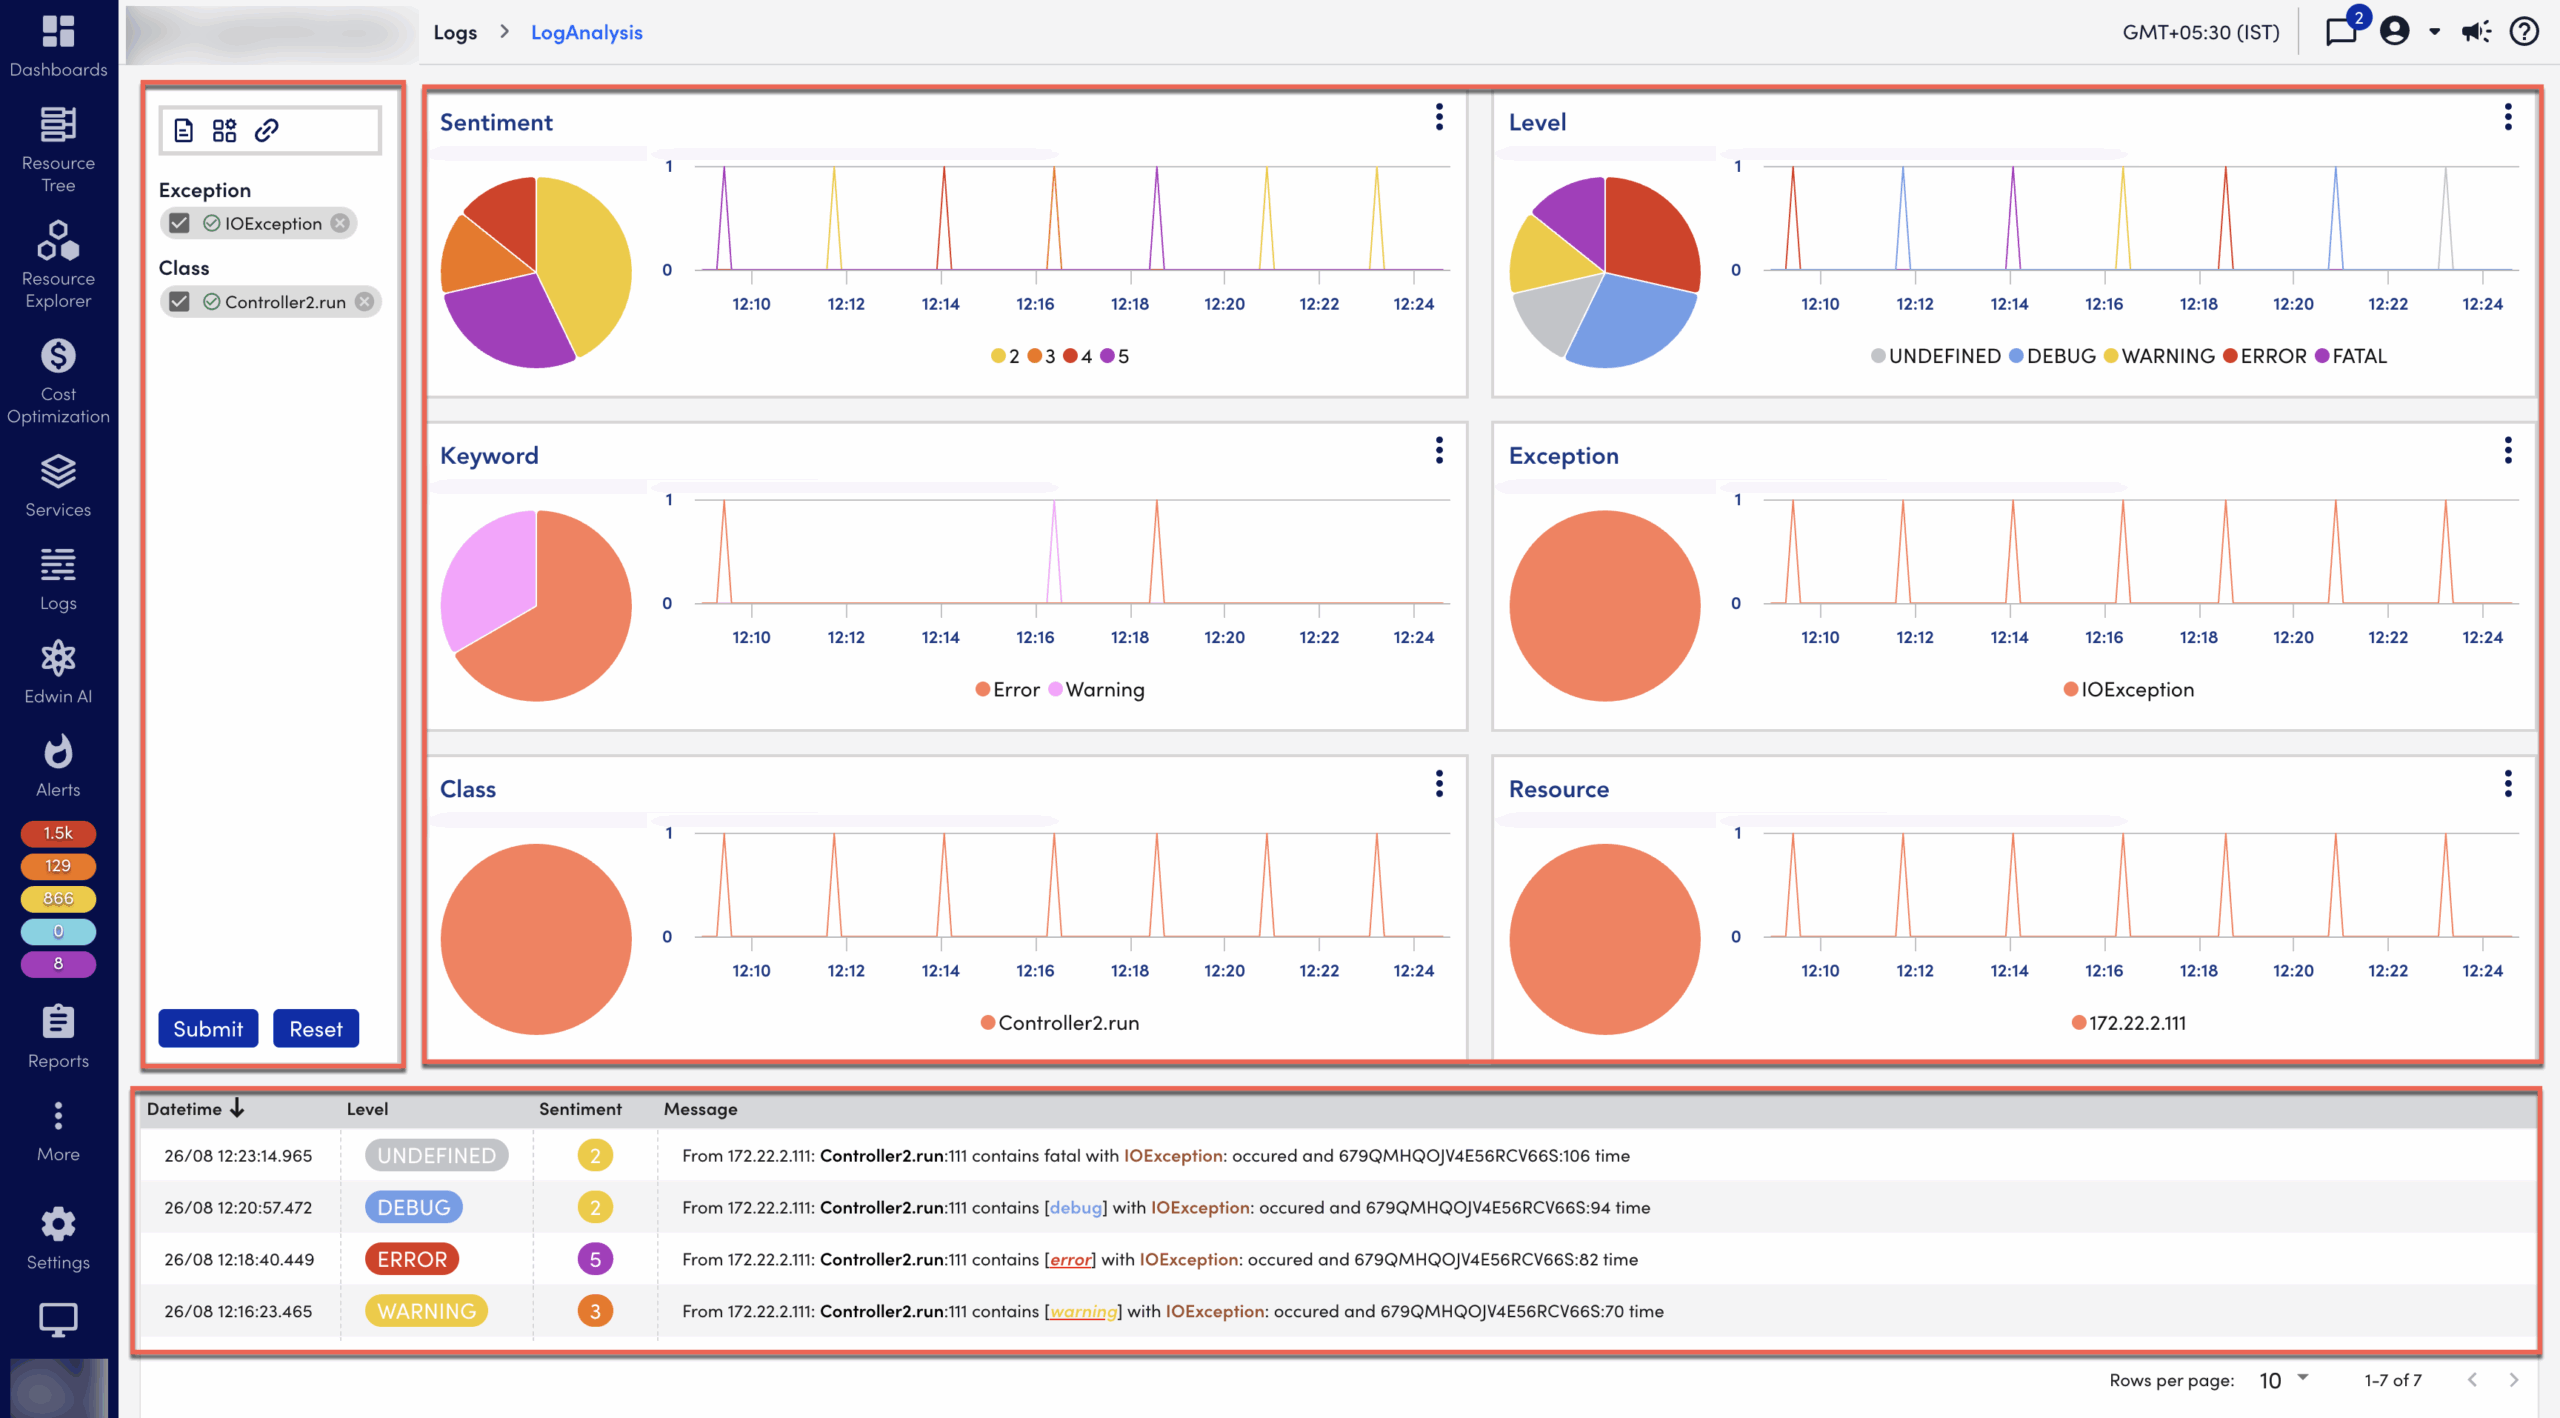
- Widgets— The widgets are graphs that group logs into dimensions. The default dimensions are keywords, class, exceptions, sentiment, and level. The graphs displays a count of all the logs associated with values of each dimension in a pie chart and show when they happened with the time series line chart.
- Filter— The Filter section displays the filters that you apply to a widget. You can submit or reset the applied filters using this section.
- Logs Table— The logs table displays the filtered logs in a meaningful way, with extra information like sentiment and highlighted keywords.
Related Topics:
