
LogAnalysis Widgets
Last updated – 11 November, 2025
The LogAnalysis page displays widgets, which you can use to filter logs from the logs table. As an example, refer to the following LogAnalysis page.
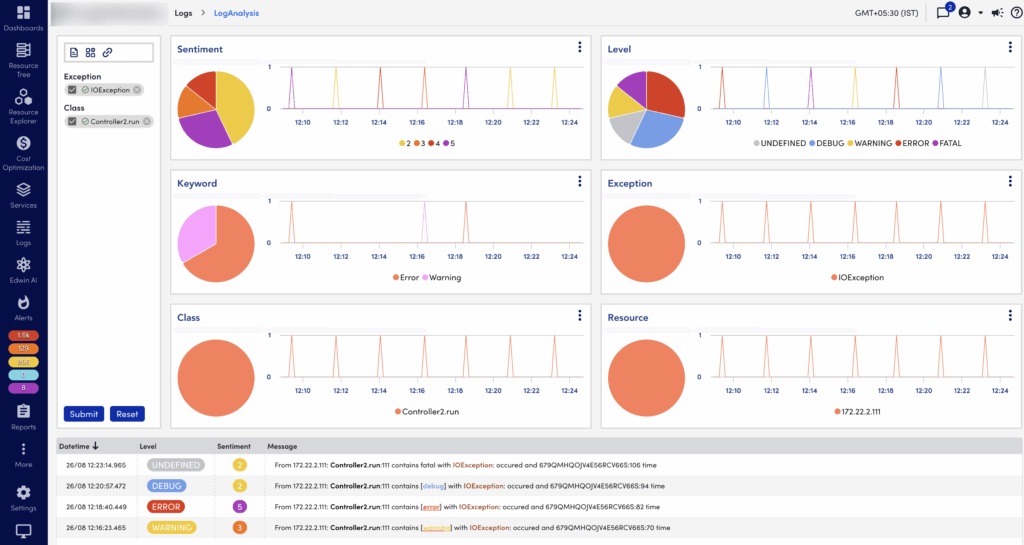
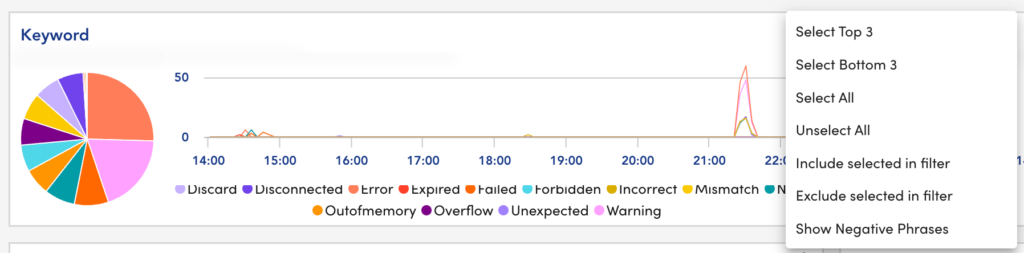
The widgets display the top 4 dimensions as time series using a Line chart and aggregated using a Pie chart. You can perform the following operation on a dimension using the widget menu.
- Select top 20% – Displays only top 20% in the pie chart and line graph by count (maximum 5)
- Select bottom 20% – Displays only bottom 20% in the pie chart and line graph by count (minimum 5)
- Select all
- Unselect All
- Include selected in filter – Includes what is displayed in the filter
- Exclude selected in filter – Excludes what is displayed in the filter
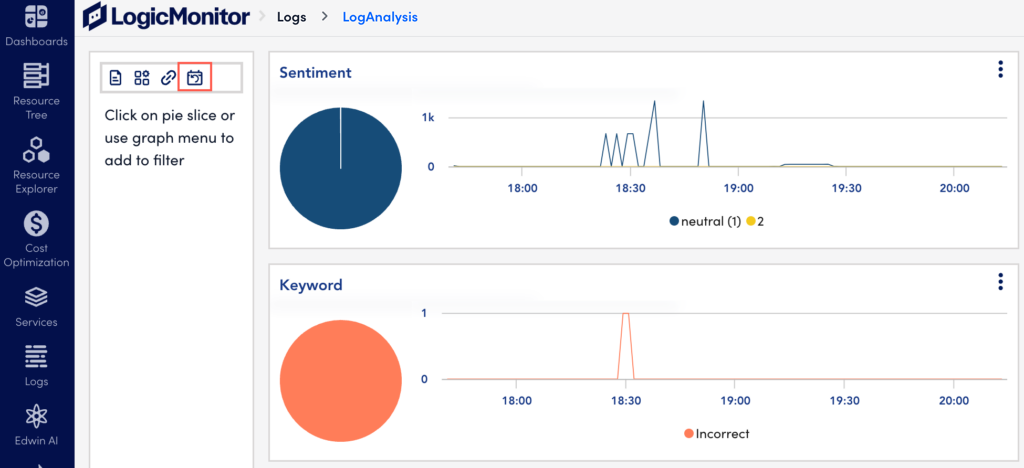
You can zoom in on the time range of widgets. The time range of each dimension remains the same. Zooming on a dimension (by dragging along the x-axis of the graph to set a smaller time range) causes the other dimensions to zoom into the same time range as well. Messages in the logs table will filter to the correct time range as well. You can reset the graph to its original time range by using the Reset button from the filter section.
The following widgets are available on the LogsAnalysis page:
- The Sentiment widget— This combines multiple criteria and dimensions to create a sentiment score for each log message. This helps to filter the most critical and impactful logs faster. The sentiment score options are 1 (neutral), 2, 3, 4, 5. The sentiment score is a granular value for what our post-processing algorithms think is ‘interesting’ in the context of debugging and troubleshooting. The log level multiplier defined as:(Fatal/Error : 3, Warn: 2, debug: 1.2, info: 1)
- The Level widget— This combines level criteria such as Error, Undefined, and others to filter log messages. Level is an interpretation of the sentiment score and is presented as a filterable dimension field. The scoring of each log line allows for bringing the most relevant log lines to the top. The level is defined on the range 1 to 5, with 1 being the least interesting (neutral). Each of these scores falls into a 1 to 5 range, and the resultant level breakdown for the sum is as follows:
| Range | Level |
| 15 | 5 |
| 12-14 | 4 |
| 8-11 | 3 |
| 4-7 | 2 |
| 0-3 | 1 |
- The Resource widget— This uses the resource ID to filter log messages.
- The Exception widget— This uses exceptions to filter log messages.
- The Class widget— This uses the class of the resources to filter log messages.
- The User Dimensions widget— You can use user dimensions to create a widget based on the criteria you define to filter log messages. You can create searchable dimensions and decide when those dimensions should apply.
To create a user dimension, from your LogAnalysis session, from the filter section, select the User Dimension icon.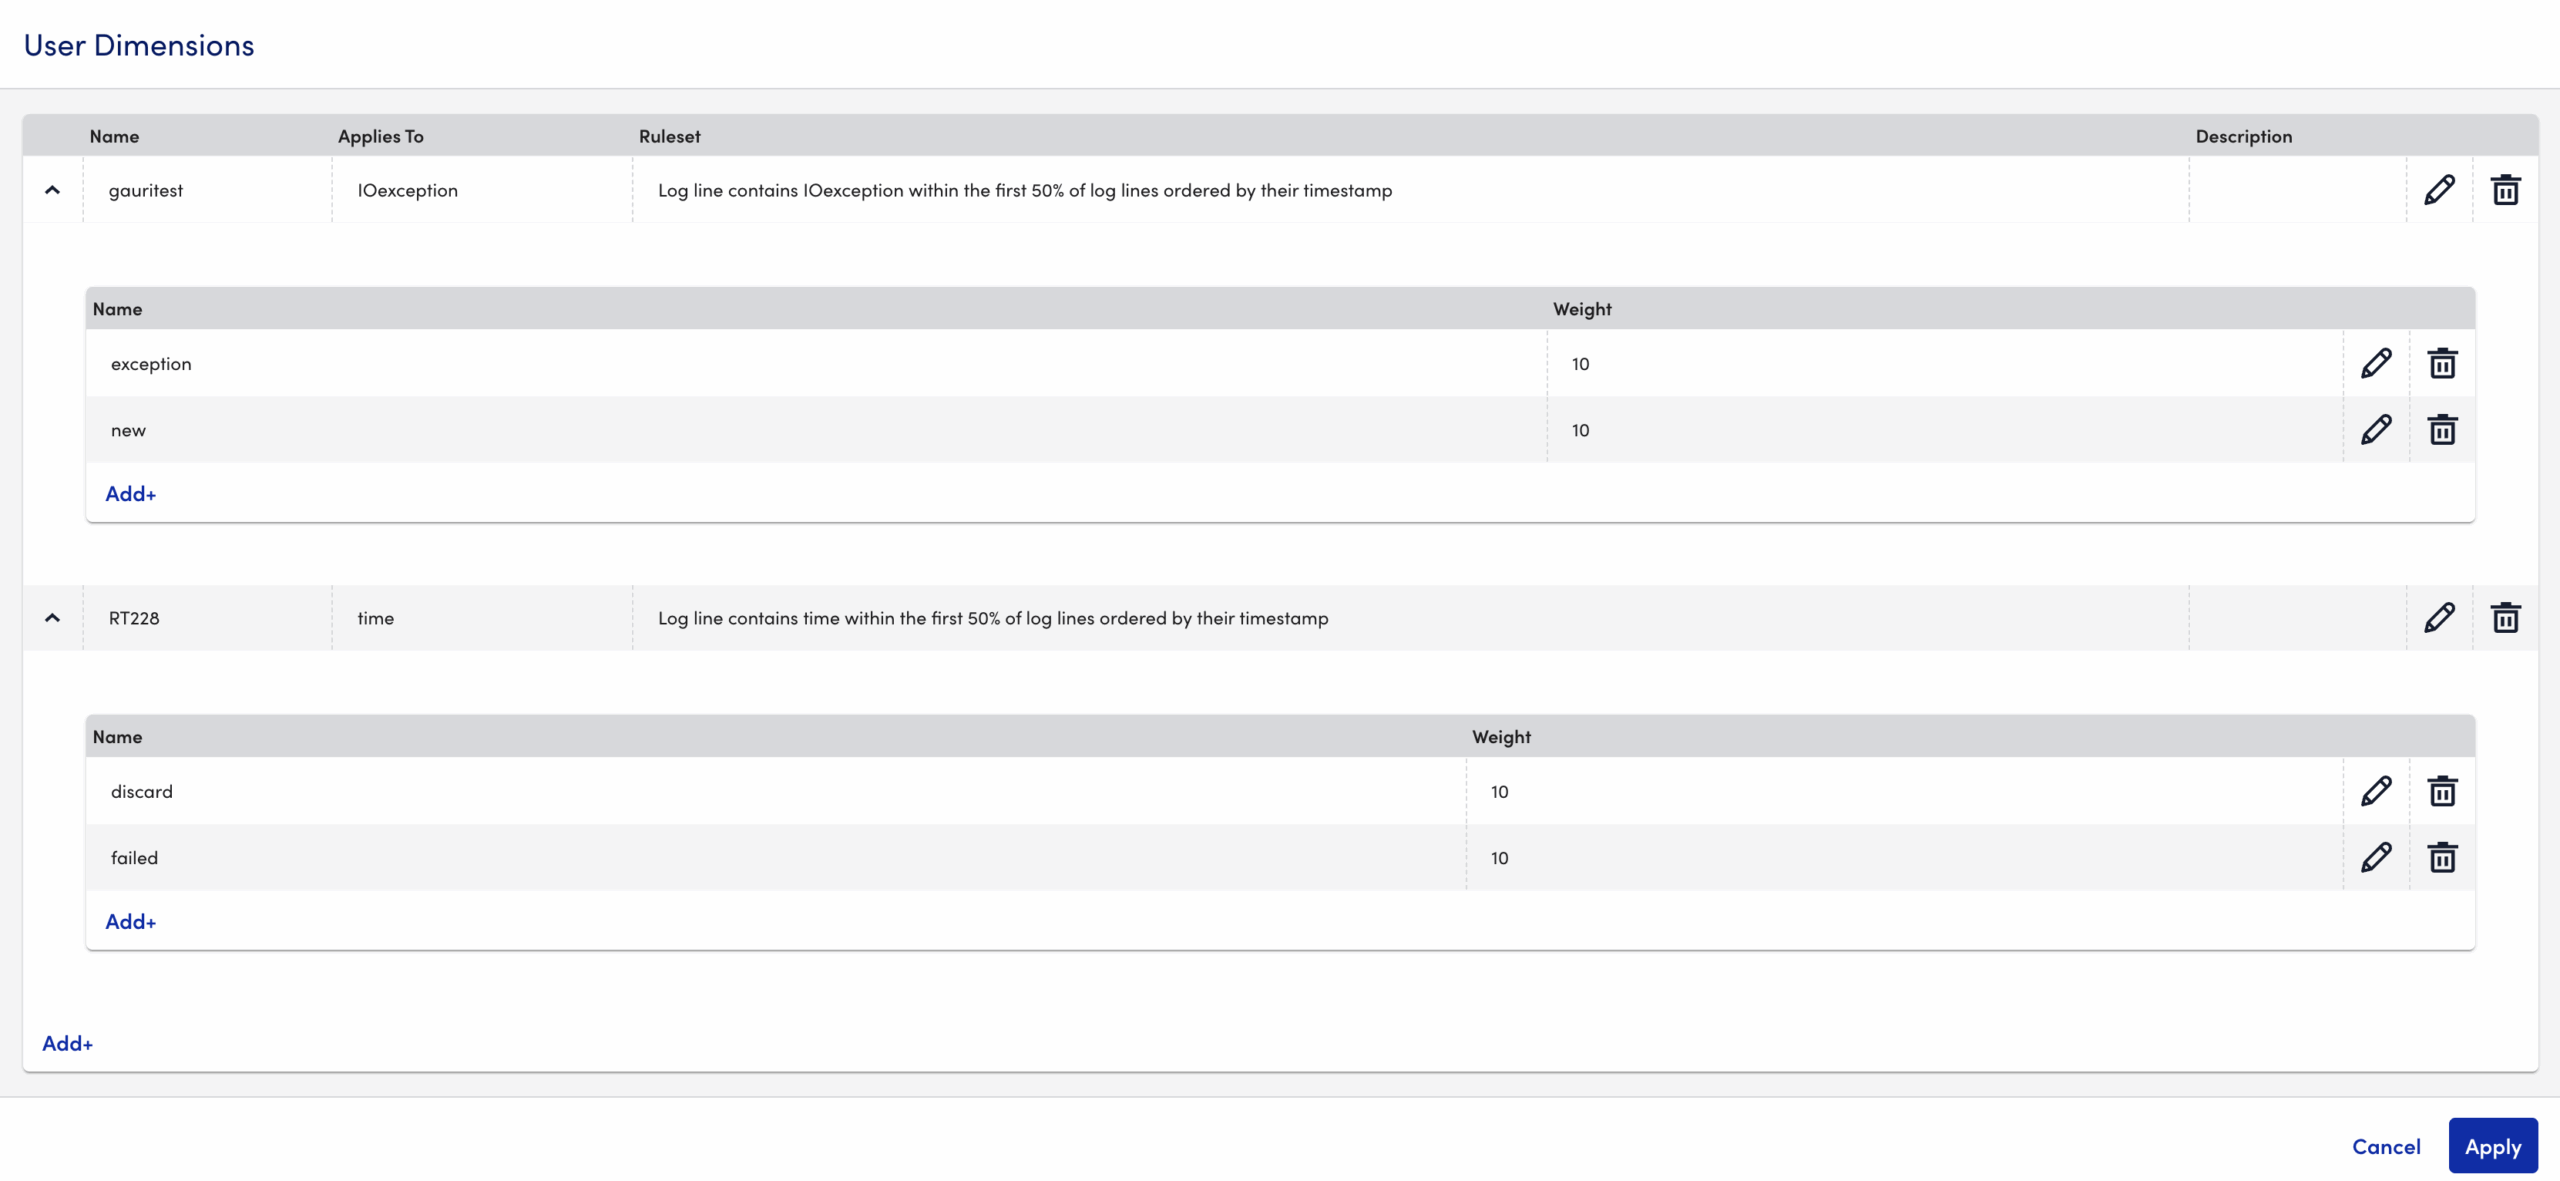
On the User Dimensions panel, select +Add to add a user dimension. You need to add dimension and the keywords associated with them.
A dimension is defined as a ruleset and an applicable value. At the moment, the first and only ruleset is checking if the applicable value shown under “Applies To” column is present within a portion of the logs ingested.
A user dimension contains keywords. A keyword is defined as the string that is searched for, and a weight that gets applied to the calculated sentiment score. The weight has an arbitrary effect on scoring. Keyword weight selection is as follows: Trivial (10), Low (20), Medium (40), High (75), and Critical (100).
When a dimension and keywords are defined, select the Save button, and then select the Apply button. If the ruleset condition is met and the keyword is found, a dimension is generated and displayed like the others. These dimensions are defined at a company level and will be calculated on subsequent LogAnalysis sessions.
- The Keywords widget – This combines keywords such as error, failed, and others to filter log messages. The following table displays a list of keywords and their weight.
| Keyword | Weight |
| Abort | 30 |
| already exists | 20 |
| bad | 40 |
| blocked | 25 |
| Breakdown | 50 |
| Bug | 50 |
| can’t | 20 |
| closed | 5 |
| connection failed | 30 |
| could not | 20 |
| cannot | 20 |
| couldn’t | 20 |
| Crash | 50 |
| Critical | 60 |
| Defect | 40 |
| denied | 70 |
| didn’t | 20 |
| didn’t exist | 40 |
| discard | 15 |
| disconnected | 5 |
| error | 75 |
| exceeded | 30 |
| Exception | 80 |
| expected | 10 |
| failed | 60 |
| Failure | 50 |
| Fault | 40 |
| Forbidden | 80 |
| Glitch | 30 |
| Halt | 30 |
| Inaccurate | 50 |
| Inactive | 10 |
| Inadequate | 30 |
| Incompatible | 50 |
| Incomplete | 50 |
| Inconsistent | 40 |
| Incorrect | 50 |
| Insufficient | 50 |
| invalid | 40 |
| Irregular | 20 |
| Issue | 30 |
| limit exceeded | 50 |
| longer | 10 |
| lost | 30 |
| Malfunction | 40 |
| Misaligned | 20 |
| Misconfigured | 70 |
| Mismanaged | 20 |
| Mismatch | 70 |
| missing | 25 |
| No such instance found | 50 |
| Non-existent | 60 |
| non-recoverable | 75 |
| Not | 25 |
| not enabled | 50 |
| not found | 50 |
| Not initialized | 60 |
| null | 20 |
| offline | 50 |
| outofbounds | 100 |
| Out of bounds | 100 |
| outofmemory | 100 |
| Out of memory | 100 |
| outofrange | 90 |
| Out of range | 90 |
| Overflow | 90 |
| Panic | 80 |
| Problem | 35 |
| refused | 50 |
| restart | 20 |
| Shutdown | 20 |
| Stop | 30 |
| takes too long | 20 |
| Terminate | 20 |
| throw | 80 |
| time out | 25 |
| timed out | 25 |
| timeout | 25 |
| too many | 30 |
| too much | 30 |
| unable | 25 |
| unauthorized | 30 |
| Unavailable | 30 |
| Underflow | 50 |
| Unexpected | 60 |
| Unforeseen | 80 |
| Unpredictable | 40 |
| Unreachable | 50 |
| Unrecognized | 40 |
| Unreliable | 20 |
| Unresponsive | 50 |
| Unstable | 50 |
| Unsuccessful | 50 |
| unsupported | 50 |
| Warning | 30 |
| without | 10 |
Related Topics:
