Jira Service Management Integration Setup
Last updated on 06 February, 2025Disclaimer: This content applies to the legacy UI and is no longer maintained. It will be removed at a future time. For up-to-date content, see Jira Service Management Integration Setup. At the time of removal, you will automatically be redirected to the up-to-date content.
Integrating with Jira Service Management involves configuring the settings in your LogicMonitor portal. These settings establish communication between LogicMonitor and your Jira instance using the Jira Service Management Cloud REST API, and allow you to configure the behavior of Jira incidents based on the LogicMonitor alerts.
You can also use the settings to establish the bi-directional communication that enables Jira to acknowledge LogicMonitor alerts by leveraging Jira webhooks. This involves generating an API Token from LogicMonitor that you add to your Jira Service Management instance.
After an integration is set up, you can use the Jira Service Management Integration settings to test the alert delivery between LogicMonitor and your Jira project.
Configuring the settings creates one instance of a Jira Service Management integration. You can configure as many instances as your environment needs.
Requirements for Integrating with Jira Service Management
To set up the Jira Service Management integration in your LogicMonitor portal, you need the following information from your Atlassian account:
- URL for your Jira Service Management server
For more information, see Atlassian’s How to find your site URL to set up the Jira Data Center and Server mobile app documentation. - Email address associated with your Atlassian account
For more information, see Atlassian’s Manage your personal profile documentation. - API Token
For more information, see Atlassian’s Manage API tokens for your Atlassian account documentation.
Important: To ensure LogicMonitor can manage (create, update, and close) the incidents in your Jira project, you must use the default Jira incident status and workflow.
Setting up the Jira Service Management Integration in LogicMonitor
- In LogicMonitor, navigate to Settings > Integrations.
- Select Add.
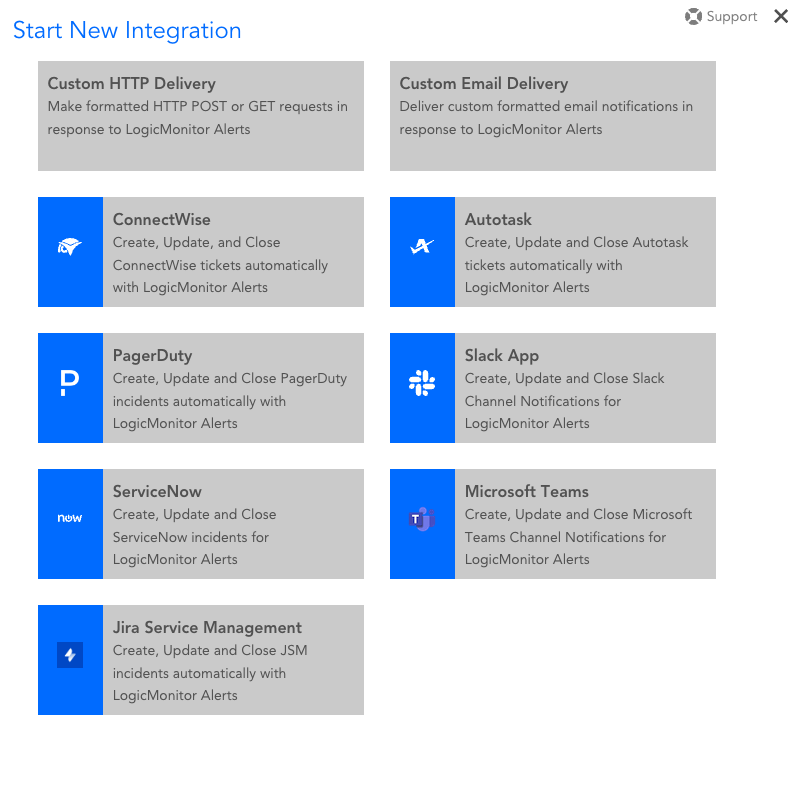
- From the Start New Integration pane, select Jira Service Management.

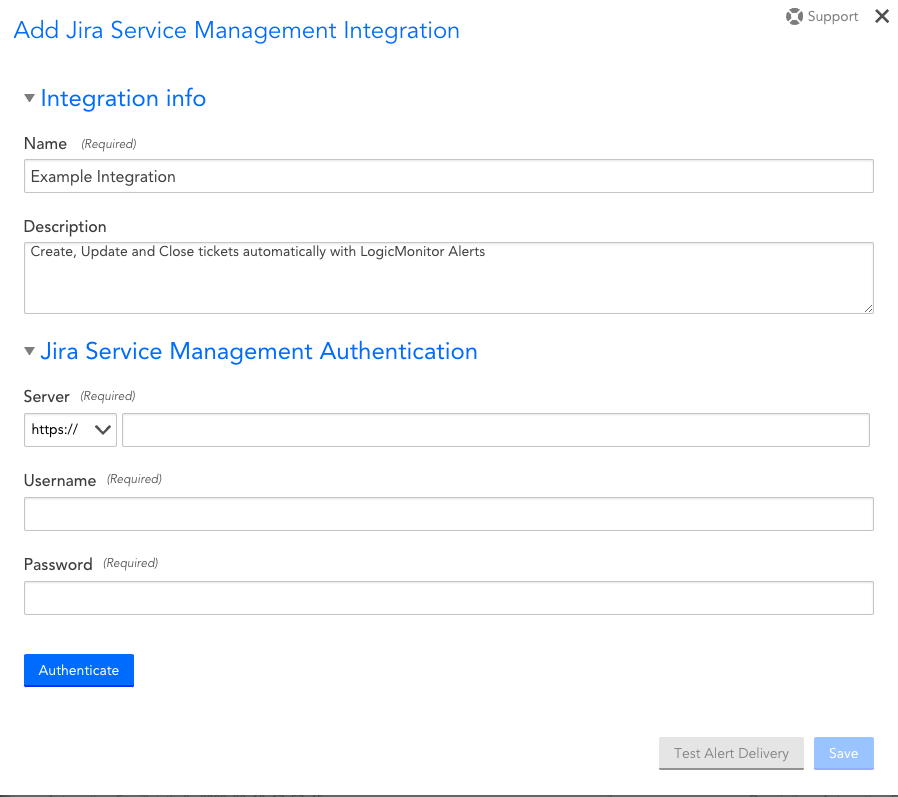
- In the Integration info settings, enter a name and description for the Jira Service Management integration.
The value you enter for Name displays in the list of integrations. - In the Jira Service Management authentication settings, do the following:
- In the Server field, enter the URL for your Jira Service Management server.
- In the Username field, enter the email address associated with your Atlassian account.
- In the Password field, enter the value of the API Token you created in your Atlassian account.
- Select Authenticate.

The Jira Service Management Incident defaults settings display after LogicMonitor authenticates to Jira.
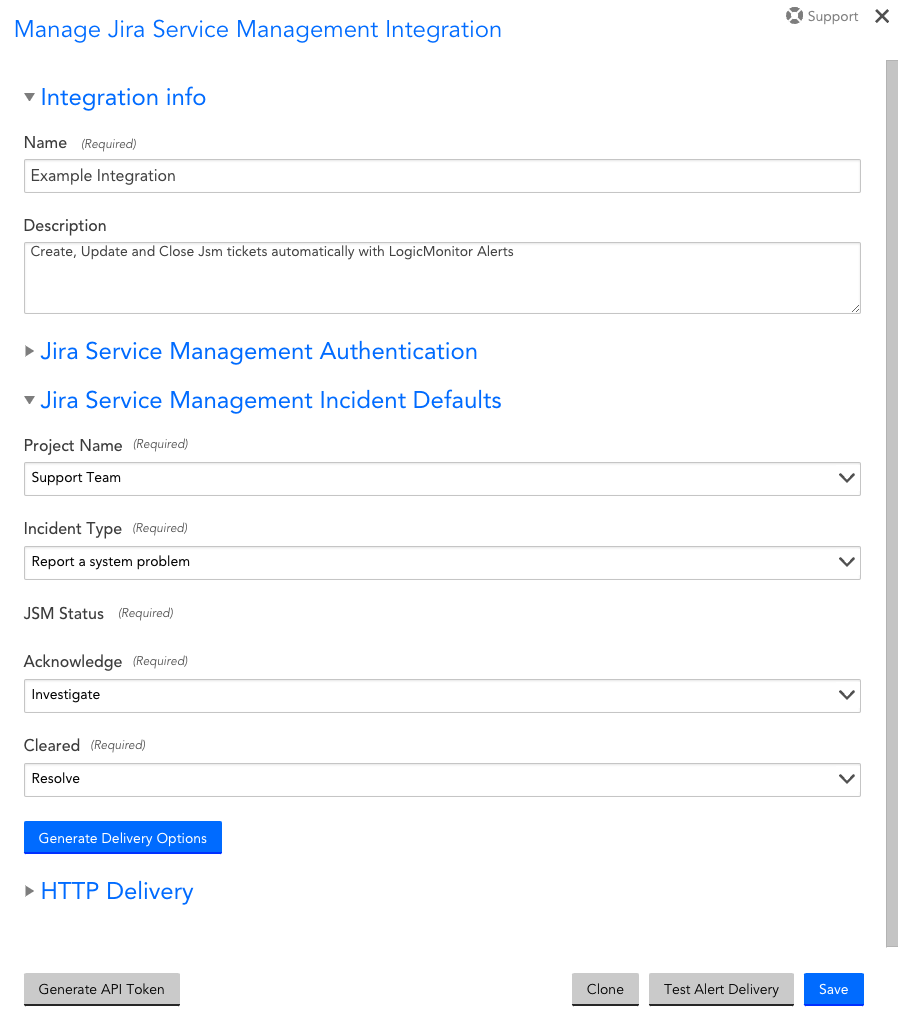
- In the Jira Service Management Incident defaults settings, do the following:
- From Project Name, select the project in your Jira instance that you want incidents created in based on LogicMonitor alerts.
- From Incident Type, select the type of incident you want created in your Jira project based on LogicMonitor alerts.
- Use the JSM Status settings to select a status in Jira to map to the LogicMonitor alert status.
For example, you can map the Jira status “Investigate” to the “Acknowledge” LogicMonitor alert status. This automatically marks LogicMonitor alerts as acknowledged when an incident moves to an investigate status in your Jira project. - Select Generate Delivery Options.

The HTTP Delivery settings display as pre-populated settings.
- Modify the HTTP Delivery settings as needed. For more information, see Custom HTTP Delivery.
Note: The HTTP Delivery settings are predefined with the data for various alert activity.
- Select Include an ID provided in HTTP response when updating alert status to return the ID of the Jira incident in response to the HTTP requests that is associated with a new alert.
- Select Save.
Enabling Jira Service Management to Acknowledge a LogicMonitor Alert
You can enable Jira to acknowledge LogicMonitor alerts by leveraging Jira webhooks. Before you can configure the webhook in your Jira instance, you must generate an API Token from LogicMonitor that you use to register the webhook. For more information, see Atlassian’s Webhooks developer documentation.
- In LogicMonitor, navigate to Settings > Integrations.
- Select Manage for the Jira Service Management integration that you want to enable LogicMonitor alert acknowledgement for.
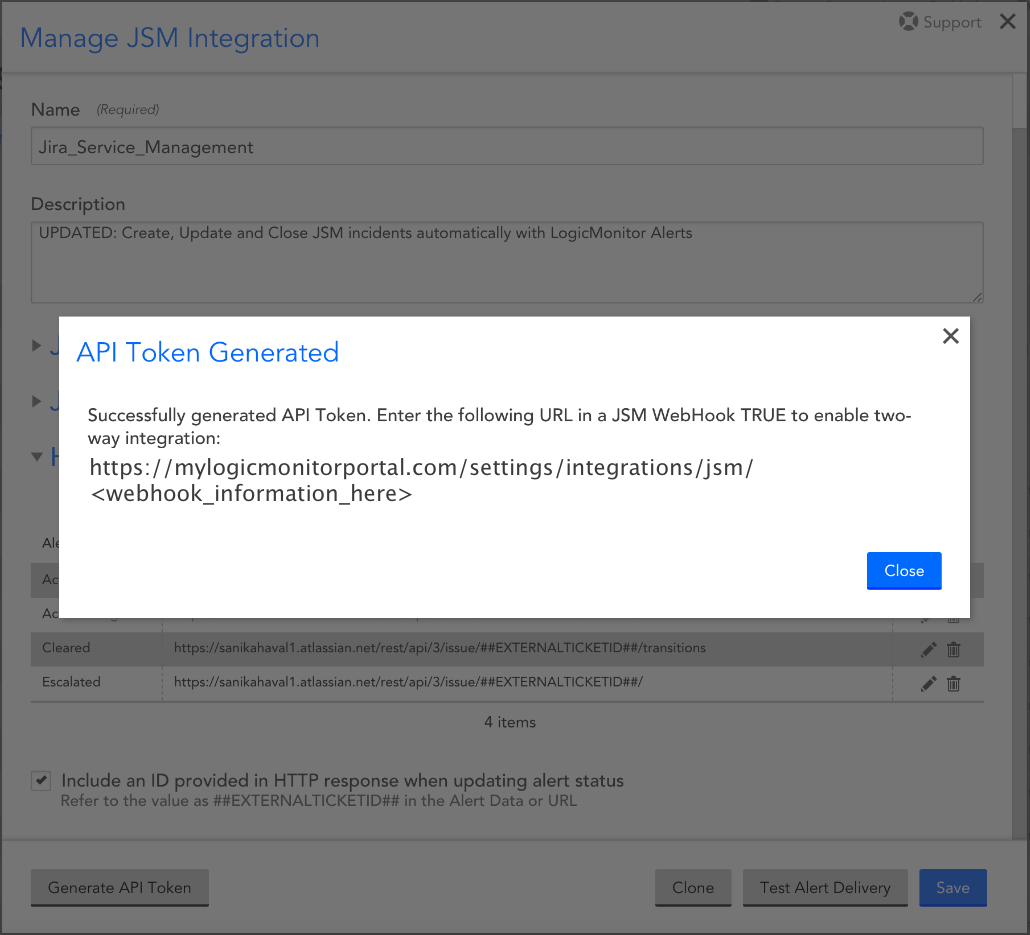
- Click Generate API Token.
A message displays containing the value for the API Token that you can use to register the webhook in your Jira instance.
- Add the API Token to your Jira Service Management instance using Atlassian’s Webhooks developer documentation to register the webhook.
Recommendation: Ensure you securely store and transfer the API Token from your LogicMonitor portal to your Jira Service Management instance. You cannot access the generated API Token after closing the message.
Important: When registering your webhook in Jira, you must specify the following JQL query for issue related events:
issuetype = "System [Incident]" AND status = "Work in Progress"
Testing the Jira Service Management
Testing the Jira Service Management Alert Delivery verifies that LogicMonitor can create incidents in Jira Service Management.
Note: Testing the alert delivery does not test the Jira Service Management to LogicMonitor communication.
- In LogicMonitor, navigate to Settings > Integrations.
- Select Manage for the Jira Service Management integration you want to test alert delivery for.
- Click Test Alert Delivery.
A message displays indicating if the response was received. Depending on your integration’s configuration, information including the ID of the Jira incident can be included in the message.