Creating a Website Dashboard
Last updated on 06 February, 2025Disclaimer: This content applies to the legacy UI and is no longer maintained. It will be removed at a future time. For up-to-date content, see Creating a Website Dashboard. At the time of removal, you will automatically be redirected to the up-to-date content.
One way to keep an eye on the websites you are monitoring is to create one or more dashboards that display the information you’re interested in.
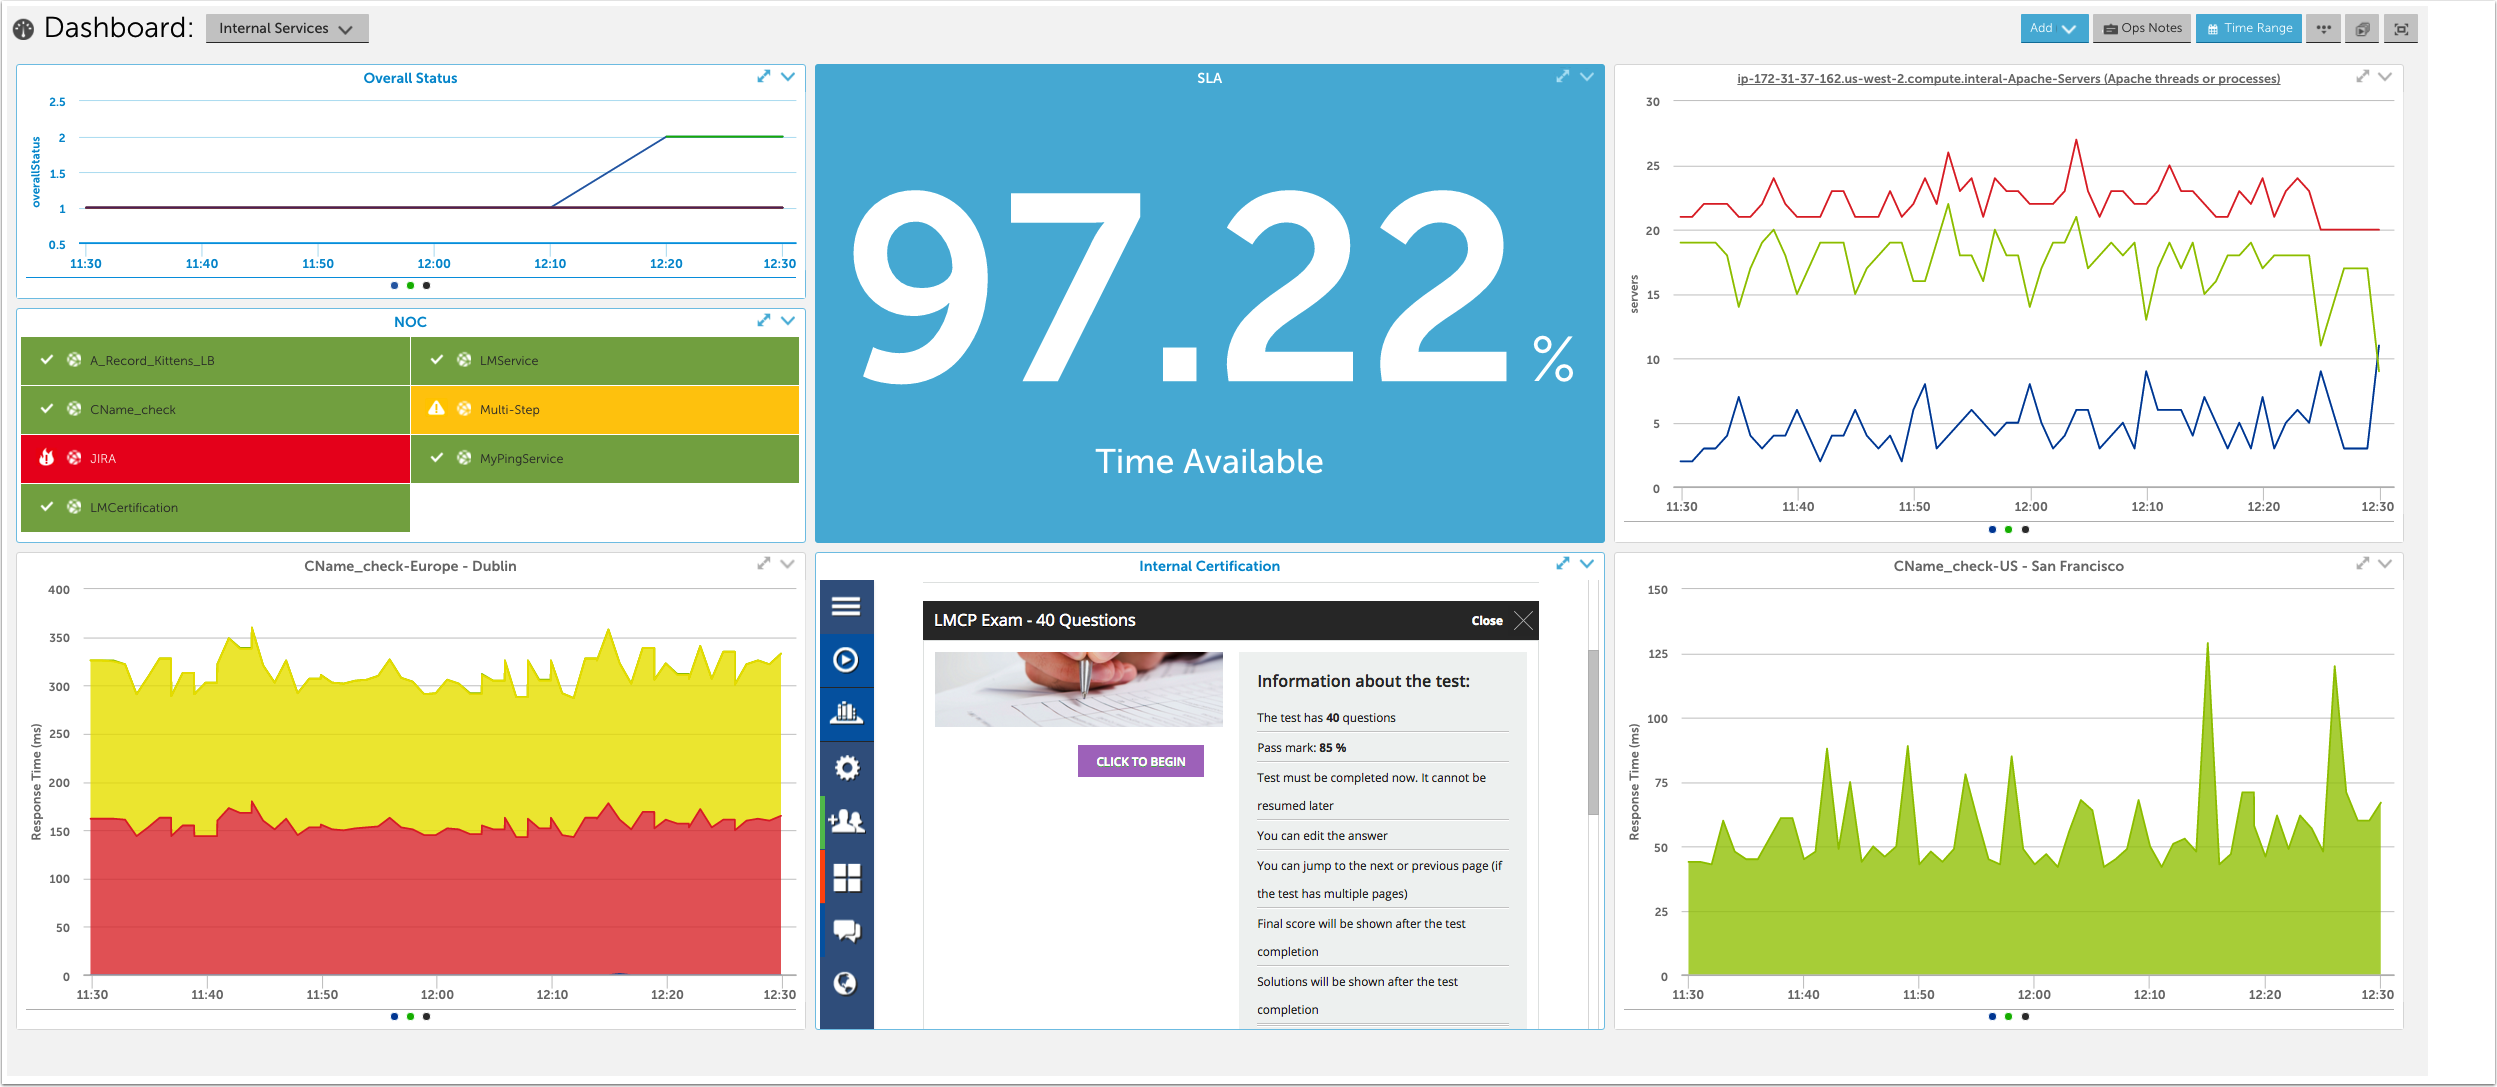
You can add dashboard widgets to show:
- the availability of your site(s) – consider using an SLA widget to show the uptime of one or more related sites
- the individual status of your site – consider using a Website Status widget to display the success or failure of the Web checks for one or more related sites
- how your site appears to external users – consider using an HTML widget to show your site as it appears to external users
- the performance of your web server – use a Custom Graph widget to display performance metrics for the application and server that are serving your website
the alert status of your site(s) – consider using an NOC widget to indicate whether your services are in alert