Sending AWS Logs

Last updated on 11 October, 2024

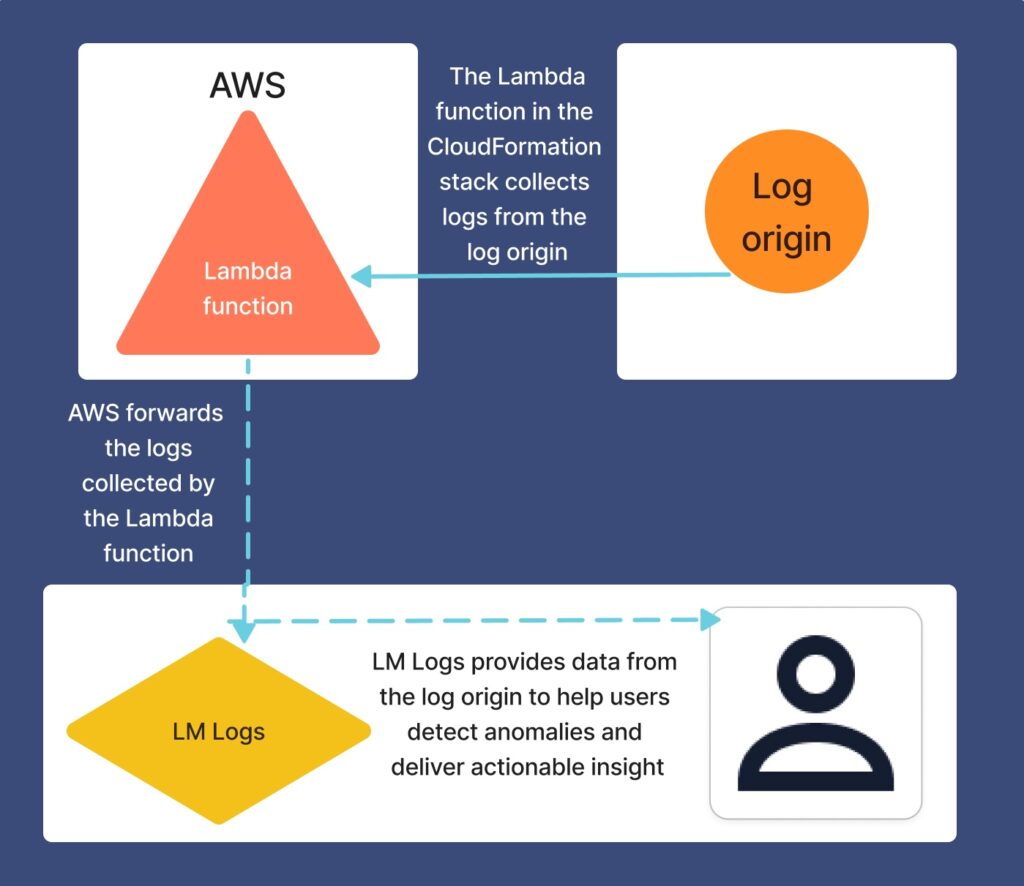
The Amazon Web Services (AWS) integration for LM Logs sends Amazon CloudWatch logs to LogicMonitor using a Lambda function configured to forward the log events. LogicMonitor provides these methods to automate the process: an AWS CloudFormation Stack template and a Terraform configuration. Both methods are described in the following.

Requirements

LogicMonitor API tokens to authenticate all requests to the log ingestion API.

Deploying Using AWS CloudFormation

Do the following to deploy the Lambda function using a CloudFormation stack template for LM Logs:

1. On the AWS integration for LM Logs repository, select “Launch Stack“.

2. Configure the stack options in the template.

Once you create the stack, a Lambda function will be deployed and subscribed to the specific CloudWatch Logs group to forward logs to LogicMonitor.

Note: The FunctionName has a default value of LMLogsForwarder. When a new Function is created, a CloudWatch log group is created with the same name (LMLogsForwarder in this case) with /aws/lambda/ prefix. If you specify a different FunctionName when creating the function, the log group will be created with that same name (aws/lambda/myfunctionname).

3. See Forwarding AWS Logs for service-specific instructions for sending logs to your CloudWatch logs group if it doesn’t already include the logs you want to forward (if it does, you can skip the information below).

Once logs are sent to the right CloudWatch Logs group, the Lambda function will automatically forward them to the log ingestion API. You should see logs and log anomalies show up in the UI (on both the Logs page and Alerts pages) shortly thereafter.

CloudFormation Stack options

Parameter Description
FunctionName (Required) The name for the log forwarding Lambda function. Defaults to LMLogsForwarder.
LMIngestEndpoint (Required) Your LogicMonitor account URL: https://<account>.logicmonitor.com
Where <account> is your LogicMonitor sandbox account or company name.
LMAccessId (Required) The LogicMonitor API tokens access ID. We recommend creating an API-only user.
LMAccessKey (Required) The LogicMonitor API tokens access key.
LMRegexScrub (Optional) Regular expression pattern to remove matching text from the log messages.

We recommend using this parameter to filter out any logs that contain sensitive information so that those logs are not sent to LogicMonitor.
FunctionMemorySize (Optional) The memory size for the log forwarding lambda function.
FunctionTimeoutInSeconds (Optional) The timeout for the log forwarding lambda function.
ResourceType (Optional) Indicates from where the AWS logs are coming from. It also indicates the location of the deployed service.

CloudFormation Permissions

To deploy the CloudFormation Stack with the default options, you need to have the permissions below to save your LogicMonitor Credential as a secret and create an S3 bucket to store the Forwarder’s code (zip file), and create Lambda functions (including execution roles and log groups).

{
           "Effect": "Allow",
           "Action": [
               "cloudformation:*",
               "secretsmanager:CreateSecret",
               "secretsmanager:TagResource",
               "secretsmanager:DeleteSecret",
               "s3:CreateBucket",
               "s3:GetObject",
               "s3:PutEncryptionConfiguration",
               "s3:PutBucketPublicAccessBlock",
               "s3:DeleteBucket",
               "iam:CreateRole",
               "iam:GetRole",
               "iam:PassRole",
               "iam:PutRolePolicy",
               "iam:AttachRolePolicy",
               "iam:DetachRolePolicy",
               "iam:DeleteRolePolicy",
               "iam:DeleteRole",
               "lambda:CreateFunction",
               "lambda:GetFunction",
               "lambda:GetFunctionConfiguration",
               "lambda:GetLayerVersion",
               "lambda:InvokeFunction",
               "lambda:PutFunctionConcurrency",
               "lambda:AddPermission",
               "lambda:RemovePermission",
               "logs:CreateLogGroup",
               "logs:DescribeLogGroups",
               "logs:PutRetentionPolicy",
               "logs:PutSubscriptionFilter",
               "logs:DeleteSubscriptionFilter"
           ],
           "Resource": "*"
}

The following capabilities are required when creating a CloudFormation stack:

  • CAPABILITY_AUTO_EXPAND, because the forwarder template uses macros.
  • CAPABILTY_IAM, CAPABILITY_NAMED_IAM, because the Forwarder creates IAM roles.

Deploying Using Terraform

Run the following terraform command to deploy the Lambda function (filling in the necessary variables):

# terraform apply --var 'lm_access_id=<lm_access_id>' --var 'lm_access_key=<lm_access_key>' --var 'lm_company_name=<lm_company_name>'

For more information, see the Sample Configuration for the LM Logs Forwarder.

Forwarding AWS Logs

After deploying the Lambda function, you should configure the individual AWS services to send their logs to the Lambda function. You can find instructions for supported AWS services below.

Sending EC2 Instance Logs

Before the EC2 instance logs can be forwarded to LM Logs, they need to be collected into CloudWatch Logs. For more information, see Installing the CloudWatch Agent.

Note: When sending EC2 logs to LogicMonitor, the logstream name must be the instance ID (typically this is the default).

After you start receiving the EC2 logs in the CloudWatch log group: 

1. In CloudWatch, select the log group (where the EC2 logs will be forwarded from).

2. Under Actions > Create Lambda subscription filter, select “Lambda function” and choose “LMLogsForwarder” (or whatever you named the Lambda function during stack creation).

3. Select Start Streaming.

Sending ELB Access Logs

To send Amazon ELB access logs to LM Logs:

1. In the EC2 navigation page, select Load Balancers and select your load balancer.

2. Under Attributes > Access logs, select “Configure access logs“.

3. Select “Enable access logs” and specify the S3 bucket to store the logs. (You can create a bucket if it doesn’t exist.)

4. Go to the S3 bucket (from Step 3) and under Advanced settings > Events, add a notification for “All object create events”.

5. Send to “Lambda function” and select “LMLogsFowarder” (or whatever you named the Lambda function during stack creation).

6. Select Start streaming.

Sending S3 Bucket Access Logs

To send Amazon access logs from an S3 bucket to LM Logs:

1. Under the source bucket’s Properties, enable Server access logging.

You will need to select a Target bucket where the access logs will be stored. If this target bucket doesn’t exist, you need to create it. (This is different from the source bucket.)

2. Go to the target bucket, and under Advanced settings > Events, add a notification for “All object create events“.

3. Send to “Lambda function” and choose “LMLogsForwarder” (or whatever you named the Lambda function during stack creation).

4. Select Save changes.

Sending Logs from RDS

To send Amazon RDS logs to LM Logs:

1. Configure the RDS instance to send the logs to CloudWatch.

2. In CloudWatch, select the log group (where the RDS logs will be forwarded from).

3. Under Actions > Create Lambda subscription filter, select “Lambda function” and choose “LMLogsForwarder” (or whatever you named the Lambda function during stack creation).

4. Select Save changes.

Sending Lambda Logs

To send Lambda logs to LM Logs:

1. In CloudWatch, select the Lambda’s log group (where the logs will be forwarded from).

2. Under Actions > Create Lambda subscription filter, select “Lambda function” and choose “LMLogsForwarder” (or whatever you named the Lambda function during stack creation).

3. Select Save changes.

The Lambda logs should be forwarded from the log group to LogicMonitor.

Sending Flow Logs from EC2

To send EC2 flow logs to LM Logs:

1. Add the following lines to the Permissions of the Lambda’s Role policy:

"logs:CreateLogGroup",
"logs:CreateLogStream",
"logs:PutLogEvents"

2. Add the following line to Service tag Role, under Trust Relationship:

"vpc-flow-logs.amazonaws.com"

3. A Log group in CloudWatch should be created with the name /aws/ec2/networkInterface

4. Search the Network Interfaces page for your EC2 instance ID. Select that Network Interface row and create a flow log with the following settings:

  • Destination Log Group: /aws/ec2/networkInterface
  • IAM Role: the role you created in Steps 1 and 2.

5. In the Log record format, select “Custom Format”. The first value of the Log Format should be instance-id. Set other values depending on your requirements. For more information, see this AWS documentation.

6. Go to the /aws/ec2/networkInterface Log Group. In Actions > Subscription filters > Create Lambda subscription filter, select “LMLogsForwarder” (or whatever you named the Lambda function during stack creation) and provide Subscription filter name.

7. Select Start Streaming.

The logs will start to propagate through the Lambda to the Log Ingestion API.

Sending Flow Logs from NAT Gateway

To send NAT Gateway flow logs to LM Logs:

1. Add the following lines to the Permissions of the Lambda’s Role policy:

"logs:CreateLogGroup",
"logs:CreateLogStream",
"logs:PutLogEvents"

2. Add the following line to Service tag Role, under Trust Relationship:

"vpc-flow-logs.amazonaws.com"

3. A Log group in CloudWatch should be created with the name /aws/natGateway/networkInterface

4. Search the Network Interfaces page for your NAT Gateway ID. Select that Network Interface row and create a flow log with the following settings:

  • Destination Log Group: /aws/natGateway/networkInterface
  • IAM Role: the role you created in Steps 1 and 2.

5. Go to the /aws/ec2/networkInterface Log Group. In Actions > Subscription filters > Create Lambda subscription filter, select “LMLogsForwarder” (or whatever you named the Lambda function during stack creation) and provide Subscription filter name.

6. Select Start Streaming.

The logs will start to propagate through the Lambda to the Log Ingestion API.

Sending Logs from CloudTrail

To send logs from AWS CloudTrail to LM Logs:

1. On the CloudTrail page of your AWS portal, select Create Trail.

2. Provide Trail name.

3. Uncheck “Log file SSE-KMS encryption” if you do not want to SSE-KMS encrypt your log files.

4. Check “CloudWatch Logs Enabled” and provide log group name as: /aws/cloudtrail

5. If you have existing IAM role CloudTrail permissions, provide it as input in IAM role box. Else a new role can also be created, make sure to provide a name for the new role.

6. In the next page, choose the Event type for the logs that you would like to collect. For more information, see this AWS documentation.

7. In the next page review the provided configuration and select Create Trail.

8. Go to CloudWatch’s log group page and select the /aws/cloudtrail log group.

9. In Actions > Subscription filters > Create lambda subscription filter—In lambda function select “LMLogsForwarder” (or whatever you named the Lambda function during stack creation) and provide Subscription filter name.

10. Select Start Streaming.

Logs will start to propagate to LM Logs. You will be able to see logs in the AWS account name resource.

Sending Logs from CloudFront

To send logs from AWS CloudFront to LM Logs:

1. In the CloudFront page of your AWS portal, select the distribution for which you would like to collect logs.

2. Select “On” for Standard Logging.

3. In S3 bucket for logs, select the bucket in which you want to store the logs.

4. Select Create Distribution.

5. Go to S3 bucket that you had selected in 3rd step.

6. Go to Properties > Event notifications and select Create event notification.

7. Provide an Event name.

8. In Destination’s Lambda function tab, select “LMLogsForwarder” (or whatever you named the Lambda function during stack creation).

9. Select Save changes.

You will be able to see logs from your S3 bucket in LM Logs.

Sending Logs from Kinesis Data Streams

Since logs from Amazon Kinesis Data Streams are filtered from AWS CloudTrail, you can follow the CloudTrail instructions to ingest these logs.

Sending Logs from Kinesis Data Firehose

Amazon Kinesis Data Firehose consists of two kinds of logs: API Logs and Error Logs. API Logs are collected from CloudTrail, and you can follow the CloudTrail instructions to ingest these logs.

To ingest Error logs:

1. In Create delivery system > Configure system, select “Enabled” for Error Logging.

This creates a log group in CloudWatch with the delivery system’s name in the format: /aws/kinesisfirehose/<Delivery system name>

2. In Actions > Subscription filters > Create lambda subscription filter—In lambda function select “LMLogsForwarder” (or whatever you named the Lambda function during stack creation) and provide Subscription filter name.

3. Select Start Streaming.

Logs will start to propagate through lambda to LogIngest. You will be able to see logs with the Kinesis Firehose delivery system’s name.

Sending Logs from ECS

Since logs from Amazon ECS are filtered from AWS CloudTrail, you can follow the CloudTrail instructions to ingest these logs.

Sending EKS Logs

Pre-requisites:

On EKS Cluster, do the following:

  1. Create a nodegroup on cluster.
  2. Add Amazon CloudWatch Observability plugin (add-on).

– Or –

Before the EC2 instance logs can be forwarded to LM Logs, they need to be collected into CloudWatch Logs. Forward different EKS logs to cloudwatch.

  1. To forward application metrics to cloudwatch, see Setting up the CloudWatch agent to collect cluster metrics from Amazon.
  2. To forward application logs to cloudwatch, see Send logs to CloudWatch Logs from Amazon.  
  3. To forward logs using Fluenbit, see Set up Fluent Bit as a DaemonSet to send logs to CloudWatch Logs from Amazon.  

After adding the plugin, the following five different log groups are created into CloudWatch using your cluster-name:

  • /aws/containerInsights/<cluster-name>/application
  • /aws/containerInsights/<cluster-name>/host
  • /aws/containerInsights/<cluster-name>/performance
  • aws/containerInsights/<cluster-name>/dataplane
  • /aws/eks/<cluster-name>/cluster

Sending EKS Logs

Do the following for specific log group you want to send:

  1. Go to Cloudwatch, select the EKS’s log group of which you want to forward logs, under Actions > Create Lambda subscription filter.
  2. In Create Lambda subscription filter, select Lambda Function and select LMLogsForwarder (or whatever you called the Lambda function when you created the stack) and select Start streaming.

Sending Bedrock Logs

  1. The following two types of logs are supported by AWS Bedrock and these can be sent to AWS Cloudwatch.
  2. Create a Log group in CloudWatch with name that contains “bedrock” in it.

Note: To differentiate between modelInvocation and knowledge-base logs, by default, for modelinvocation logs, the logstreams name contain string “modelinvocations” and for knowledge-base logs, the Log group name contains “knowledge-base” or “vendedlogs”.

  1. Go to the Log Group created by bedrock as above.
  2. Navigate to Actions > Subscription filters > Create lambda subscription filter.
  3. Select Lambda Function and select LMLogsForwarder (or whatever you called the Lambda function when you created the stack) and select Start streaming.

Logs will start to propagate through lambda to LogIngest.
The Model Invocation logs will be mapped to the Bedrock model resource created in Logicmonitor and the knowledge-base logs will be mapped to the AWS account resource created in Logicmonitor.

Sending EventBridge (CloudWatch) Events

Amazon EventBridge (CloudWatch) Events provides real-time event streams describing changes in AWS resources. You can use simple rules to setup, match, and route events to functions or streams through AWS EventBridge. For more information, see CloudWatch Events from Amazon documentation.

Requirements

Setup AWS and LogicMonitor integration. For more information, see Sending AWS Logs.

Creating Amazon EventBridge Rule

You need to create one rule for one service. The event pattern in the rule specifies which service events will be sent to the target. For the target, specify the Lambda function as LMLogsForwarder or the Lambda that sends logs to LM. The currently supported services for CloudWatch events are S3, Lambda, ECS, Kinesis, SQS, EC2, and Account.

To create a rule to setup CloudWatch events, do the following:

  1. Go to Amazon EventBridge web page and select Rules.
  2. On the Define rule detail page, provide the name and description for the rule. 
  3. To choose a Rule type, select Rule with an event pattern.This makes sure that whenever an event is generated, it sends the events to target.
    AWS define rule page
  1. For Method, select the Use Pattern Form method to get readymade pattern for a specific service.
  2. In the Event source field, select AWS services.
  3. In the AWS service field, selecta service. LogicMonitor currently supports S3, Lambda, ECE, Kinesis, SQS, EC2, and Account services for CloudWatch events.
  4. In the Event type field, select AWS API Call via Cloudtrail. As per the current implementation, LogicMonitor supports only AWS API calls via Cloudtrail. The events coming from the other types are ignored.
    AWS defile pattern page
  1. On the Select target(s) tab, do the following:
    • For Target types, select AWS service.
    • For Select a target, select Lambda function.
    • For Function, select LMLogsForwarder or the Lambda that sends logs to LM.
      AWS select targets page
  1. Select Next to review the rule and then select Create.

When the rule is successfully created, you can view the logs in LM Logs page as below. You can also view the message in JSON format in the Overview panel.

LM Logs page

For more information, see Creating Amazon EventBridge rules that react to events from Amazon.

Metadata for AWS Logs

The following table lists metadata fields for the AWS Logs integration with LM Logs. The integration looks for this data in the log records and adds the data to the logs along with the raw message string.

PropertyDescriptionLM MappingDefault
arnAmazon Resource Name, unique identifier for AWS resources.arnNo
awsRegionRegion for the AWS resource.regionNo
eventsourceThe source service sending the event._typeYes
ResourceTypeIndicates from where the AWS logs are coming from. It also indicates the location of the deployed service.ResourceTypeYes

Troubleshooting

To help troubleshoot logs forwarded from Amazon CloudWatch, enable debug logging in your Lambda logs:

1. In the AWS console, go to AWS Lambda > Functions and select “LMLogsForwarder” (or whatever you named the log forwarding Lambda function during setup).

2. Add an environment variable with the key DEBUG and value true.

Migrating AWS Lambda runtime from Go1.x to Amazon Linux 2

Lambda function forwarder is written in Golang. As AWS is deprecating Go1.x runtime, it is encouraging its customers to upgrade to Amazon Linux 2 runtime.

To migrate AWS Lambda runtime from Go1.x to Amazon Linux 2 runtime, do the following:

  1. Download the latest lambda.zip from the s3 URL.
  2. Go to Amazon console and search for CloudFormation.
  3. On the CloudFormation page, select Stacks lm-forwarder.
  4. On the Resources tab, select the lambda forwarder.
  5. On the Lambda Function page, select the Code tab, and then select Upload from > .zip file.
  6. Upload the latest lambda.zip file downloaded earlier, refer to step 1.
  7. Go to the Runtime settings section, select Edit and do the following:
    1. In the Runtime field, select Custom runtime on Amazon Linux 2.
    2. In the Handler field, type bootstrap.
      AWS runtime settings page
  8. Select Save.
In This Article