Pie Chart Widget
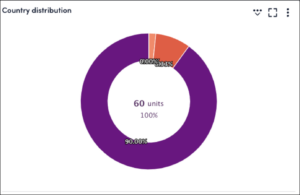
Last updated on 20 August, 2024Whether your business measures success based on the current value of a single metric, the aggregate value of metrics across devices, a value from your database, or a combination of any of the above, you can represent it in an at-a-glance view with the Pie Chart or Donut Chart widget.

Configuring a Pie Chart widget is a multistep process, similar to Big Number and Custom Graph widgets:
- Select the datapoints you wish to include. These can be datapoint values on a single instance or across multiple instances.
- Create virtual datapoints to change units of measure, combine values, or perform a function on the value prior to display, as desired.
Note: As with other widgets, you can select individual Groups, Resources, or Instances, or use glob expressions to include many. You can also add multiple values of the same unit of measure together to create a single value.
- Select which values display in the Pie Chart widget. This allows you to use virtual datapoints, which may rely on a datapoint that does not display individually in the widget.
Configuring a Pie Chart Widget
- Create a Pie Chart widget. For more information, see Widget Creation.
- Configure Basic Information fields. For more information, see Configuring Standard Widget Settings.
- In the Pie Chart Options settings, select + Add Record to begin adding datapoints to your widget. For more information, see Widget Datapoint Configurations.
Warning: A specific datapoint must be selected and you must add at least one datapoint for pie items to display.
Note: The Record Name is a unique identifier for the datapoint(s) that can be used to create the Pie Chart legends and virtual datapoints.
4. In the Pie items settings, select + Add Record to begin adding items to your pie chart:
a. In the Record Name field, select a record name to add a datapoint to your pie chart.
b. (Optional) In the Legend field, enter a unique name for the pie item to be identified by in the widget legend.
Insert a token in the Legend field to display labels derived from tokens defined on the dashboard or dashboard group in which the widget resides. Tokens are inherited from the dashboard or dashboard group, so moving a widget can change the value of the resolved tokens.
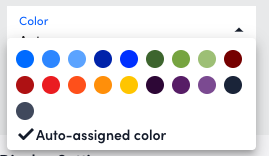
c. (Optional) In the Color field, select a color option to associate with this pie item:
- Auto-assigned color: LogicMonitor automatically assigns a color to your pie item.
- A specific color: For a multi-instance datapoint the same color displays for each datapoint and is separated by slice markers.

d. Select Apply.
Continue adding pie items for all your datapoints to display in the Pie Chart widget.
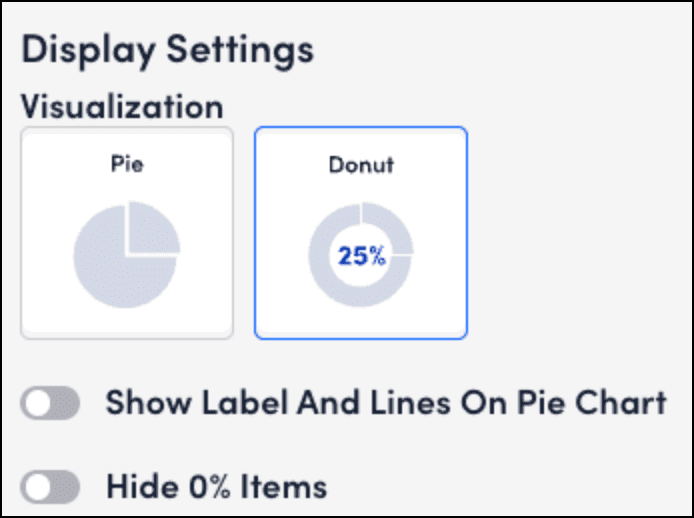
5. (Optional) In the Display Settings, configure the following options:
- In the Visualization section, select one of the following options:
- Pie Chart: Allows you to compare datapoints, compare and count resources, and helps in datapoints calculation.
- Donut Chart: Displays data in donut chart.
- Toggle on Show Label and Lines on Pie Chart to show the legends as labels connected to the pie chart with lines.
- Toggle on Hide 0% Items to hide any datapoints that are 0% of the total on the pie chart.

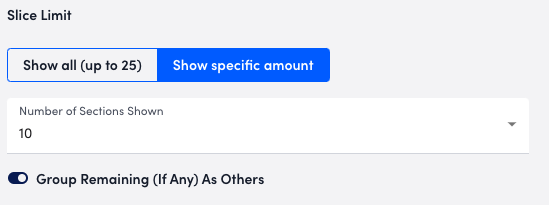
6. (Optional) In the Slice Limit settings, select one of the following options:
- (Default) Show all (up to 25): Shows all slices in the pie chart.
- Show specific amount:
- Select a specific number of pie slices to show in the pie chart from the Number of Selections dropdown.
- (Optional) Toggle on Group Remaining (If Any) As Others to group any remaining slices in the pie as Other.

7. Complete the standard widget configurations, and then Save the widget. For more information, see Configuring Standard Widget Settings.
Pie Chart Widget Dashboard Display
After you configure a pie chart widget, it displays on the dashboard along with the legends. Legends are displayed in the following ways:
- When you hover over a pie slice
- At the bottom of the widget under the pie
- As a label on the pie chart
