Alerts Report
Last updated on 06 February, 2025Disclaimer: This content applies to the legacy UI and is no longer maintained. It will be removed at a future time. For up-to-date content, see Alerts Report. At the time of removal, you will automatically be redirected to the up-to-date content.
Overview
The Alerts report returns a list of all alerts—either every individual alert that matches the parameters or a count of the number of times each alert occurred—during a specified time frame. Viewing non-critical alerts in a report can reduce the number of alerts you need to be notified of, and can provide additional context because you see multiple alerts and their time frames right next to one another.
Here are a few common ways LogicMonitor users use the Alerts report:
- If you have one or more resources (e.g. device, cloud resource, website) in SDT, you may want to use the Alerts report to quickly view all of the alerts for those resources. This can help you to ensure you’ve addressed all potential issues before SDT ends.
Note: If the alert is cleared and the device is in SDT, the alert does not display in the alert table.
- To identify alerts that have been active for a long period of time. You can then tune your thresholds to eliminate future alerts of that nature.
- To evaluate how long it is taking specific users to acknowledge alerts.
- To deliver a daily report that includes all alerts from the past 24 hours. Because the report can show you by how much a threshold was exceeded, you can use it as a way to determine which thresholds need adjusting. You can also use this daily report to determine if there are any alert notifications that should have been routed (via email, text, voice, etc.), but weren’t and then adjust your alert rules accordingly.
Configuring an Alerts Report
To configure an Alerts report, select Reports | Add | Report | Alerts. A report dialog appears that allows you to configure various report settings.
Configuring Settings Common to All Report Types
The first four settings that are found in the report dialog (Title, Description, Group, and Format), along with the final setting (Generate this report on a schedule), are universal to all report types. To learn more about these global report settings, see Creating and Managing Reports.
Configuring Alerts Report Settings
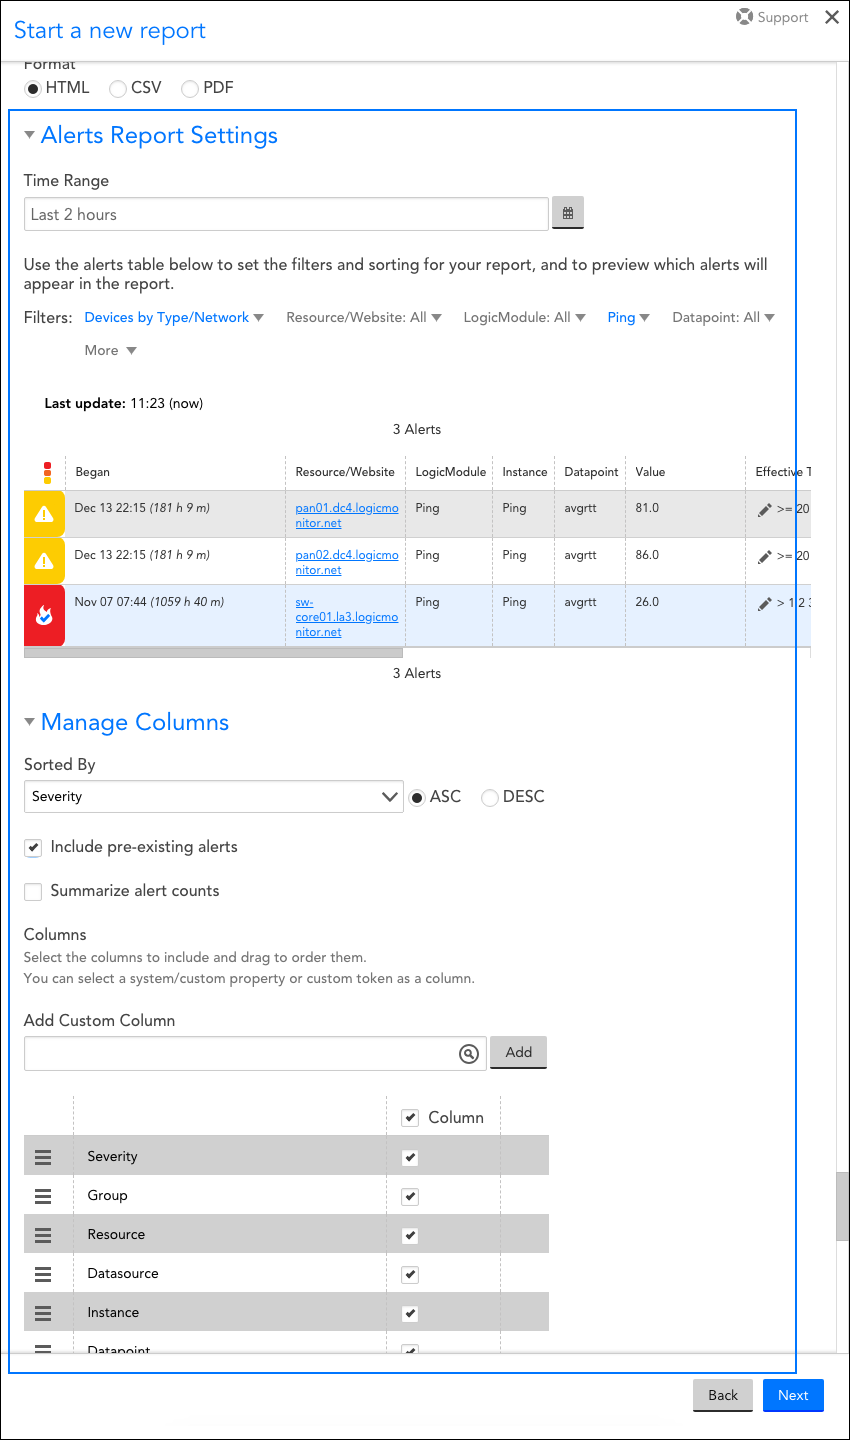
In the Alerts Report Settings and Manage Columns areas of the report configuration dialog, shown and discussed next, specify settings particular to the Alerts report including alert time range and filters.

Time Range
In the Time Range field, indicate the duration of time for which alerts will be pulled for display.
Alert Filters
You can filter the alerts displayed in this report using a variety of criteria (e.g. resource, instance, datapoint, severity level, etc.). Glob expressions are supported when setting filter criteria. For more information on Glob expressions, see Using Glob throughout your account.
As you set filter criteria, you’ll notice that the alerts table located immediately beneath the filters is dynamically updated to provide a preview of the alerts that the report will return.
Note: A maximum of 30,000 alerts will be returned in a report. If more than 30,000 alerts match your filter criteria, the resources/groups with the most alerts will be auto-excluded from the report. To avoid this, please ensure your filters are sufficiently narrow.
Sorted By
Use the Sorted By field’s dropdown menu to select the report’s sort order. To the right of this field, use the radio buttons to indicate ascending or descending order.
Note: When you choose to sort the Alerts report by severity, secondary sorting by time began (in descending order) will automatically enable. This secondary sorting functionality is similar to that available from the Alerts page, allowing you to simultaneously sort on both the alert severity level (primary sort) and the time the alert began (secondary sort).
Include pre-existing alerts
Select the Include pre-existing alerts checkbox to include alerts that began prior to the specified date range, but meet all other criteria.
Summarize alert counts
Select the Summarize alert counts checkbox to add a column to the Alerts report that details the frequency in which an alert occurred during the report time range. If this option is selected, an additional sort order of “Alerts” becomes available from the Sorted By field’s dropdown menu. This is very useful for determining the top sources of alerts, allowing you to remediate highly impactful issues or tune datapoint thresholds.
Columns
Uncheck any columns that you would like to exclude from the report. To reorder columns, grab the icon to the far left of a column name and drag and drop the column into its new position.
You can add custom columns to your Alerts report using the Add Custom Column field. LogicMonitor supports the addition of columns that represent properties or custom tokens.
