Contacts and Usage Summary Information
Last updated on 17 April, 2025Disclaimer: This content applies to the legacy UI and is no longer maintained. It will be removed at a future time. For up-to-date content, see Portal Information. At the time of removal, you will automatically be redirected to the up-to-date content.
You can view the current version of your portal and the usage summary information using the Contacts page in Account Information. In addition, you can modify contact information, such as a primary and secondary contacts to receive billing and account communications.
Note: The primary contact information is the first user you created with the wizard during your LogicMonitor portal setup.
Usage Summary
The Usage Summary tables provide usage information for monitoring activities and account features that have usage limits such as device monitoring or dynamic thresholds. Each table is devoted to a different aspect of LogicMonitor’s operations.
The following describes usage summary information for resources, alerts and maps, users and roles, and thresholds and datapoints:
| Count | Description |
| Resources | |
| Cloud Resources | A count of all resources monitored using LogicMonitor’s Cloud Collector. The overall cloud resources count is broken down by the public clouds. Note: The formula for AWS and Azure cloud resources count: Total Cloud Devices – Number of Combined Cloud Devices – Number of Account or Billing devices. |
| Config Devices | A count of all resources that ConfigSource LogicModules are applied. Note: This count is only applicable for portals with the ability to monitor and alert on configuration files. If this capability is not currently available in your LogicMonitor platform, contact Customer Success. |
| Dashboards* | A count of all existing public and private dashboards. |
| Devices | A count of all devices added to monitoring. A device is any resource that is monitored by a standard LogicMonitor Collector. In addition, you can view the overall device count broken down by standard devices and public cloud resources. Note: Kubernetes resources have a dedicated count and are not included in the devices count. |
| Instances* | A count of all DataSource instances monitored across all device, cloud, and Kubernetes resources. A single resource represents at least one instance, but may represent more if a DataSource discovers multiple instances per resource. For example, a single resource could have multiple disks, server volumes, interfaces, or other identical components requiring monitoring and each of these would be considered an instance. In addition, you can view the overall instance count broken down by DataSource. |
| Kubernetes Resources | A count of all Kubernetes, nodes, deployments, services, and pods in monitoring. |
| Reports in last 24 Hours* | The reports count includes all reports successfully generated in the past 24 hours—either manually or using a report schedule. |
| Resource Groups* | A count of all resource groups, created from the Resources page. In addition, you can view the overall group count broken down by static groups and dynamic groups. For each group type, you can see the total number of properties set at the group level. |
| Services | The services count includes all services created in LogicMonitor. A service is a grouping of instances across one or more monitored resources. This count is only applicable for portals with the LM Service Insight feature. |
| Websites | A count of all monitored websites. This includes web checks and ping checks, both internal and external. |
| Widgets* | All widgets across all dashboards, including cloned widgets and widgets added to multiple dashboards, contribute to the widgets count |
| Alerts and Maps | |
| Alert Rules* | A count of each saved alert rule definition. |
| Open Alerts | A count of current open alerts. |
| Previous Day Alerts | A count of all alerts triggered for the previous day (from 00:00-12:00). |
| Root Cause Analysis Rules | A count of each saved root cause analysis definition. This count is only applicable for LogicMonitor Enterprise portals. |
| Saved Maps | The saved maps count includes all saved topology maps. |
| Users and Roles | |
| External API Users | A count of all users currently (within last five minutes) accessing the portal using the REST API. |
| Session Users | A count of all users currently accessing the portal using the LogicMonitor user interface. |
| User Roles* | A count of saved roles. |
| Thresholds and Datapoints | |
| Complex Datapoints* | A count of complex datapoints in use. You can infer the count of normal datapoints by subtracting this count from the total datapoints count. |
| Dynamic Thresholds | The dynamic thresholds count provides both the current number of dynamic thresholds in use as well as the maximum number allowed for your account (only applicable for LogicMonitor Enterprise portals). The number of total current dynamic thresholds represents the number of times your configured dynamic thresholds are potentially evaluated. For example, if a dynamic threshold is configured once, it is inherited across multiple instances, contributing to the total. The maximum number of allowed dynamic thresholds per account is limited to eight per permitted monitored resource (per monitored resource is the total of all monitored devices, cloud and Kubernetes resources, and services). This limit is an aggregate limit, enforced at the account level, not the per-resource level. For example, if your account permits the monitoring of 100 total resources, 800 total dynamic thresholds are permitted across your portal. Note: To see where dynamic thresholds are applied across your portal, run an Alerts Thresholds report, ensuring the Only show custom thresholds option is enabled. For more information, see Alerts Thresholds Report. |
| Total Datapoints* | A count of all datapoints (normal and complex) in use. This count represents the number of times your datapoints are potentially collecting data for a resource. For example, a DataSource with five datapoints that is applied to five total instances will increase this count by 25. |
Requirements to Modify the Contact Information
To configure the contact information, you need a LogicMonitor user with “Manage” role for Account Information. For more information, see Users and Roles.
Configuring the Contact Information
- In LogicMonitor, navigate to Settings > Account Information.
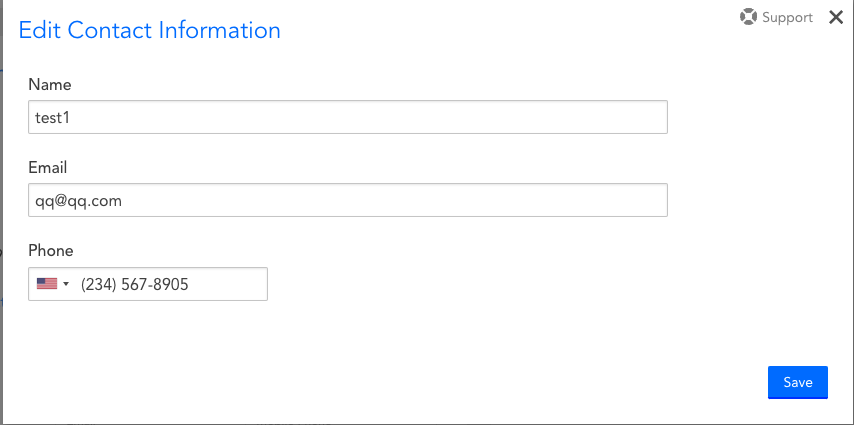
- To modify the primary contact information, select Edit primary contact in the Contact Information settings and do the following:
- Enter a name, email, and phone in the applicable settings.

- Select Save.
Primary contact information is immediately updated and displayed in the Primary Contact information.
- Enter a name, email, and phone in the applicable settings.
- To modify the Additional Contacts information, do any of the following:
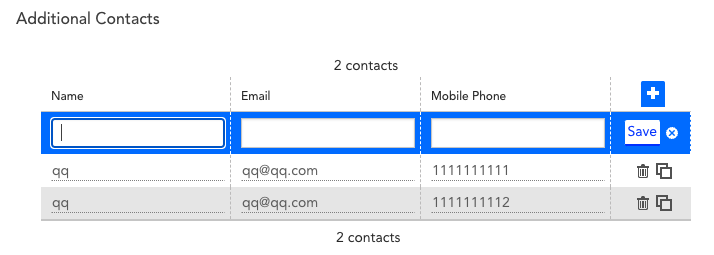
- To add a contact, select add ( + ) in the Addition Contacts settings, and do the following:
- Enter the name, email, and phone number in the applicable text fields.

- Select Save.
The additional contact is added to the Additional Contacts information table.
- Enter the name, email, and phone number in the applicable text fields.
- To clone a contact, select clone.
The contact is cloned and added to the Additional Contacts information table. - To delete a contact, select delete, and then select Delete when prompted.
The contact is immediately removed from the Additional Contacts information table.
- To add a contact, select add ( + ) in the Addition Contacts settings, and do the following: