Modern Dashboards
Last updated on 27 March, 2025With modern dashboards, you can monitor multiple hosts using a single dashboard. You can filter the hosts by using the filters based on their properties.
For example, you can monitor AWS resources from different regions using a single dashboard.
In addition, Modern Dashboard also supports widget filtering based on a group. For example, add filter resource property “system.groups”.
The following widgets are supported in Modern Dashboards and filtering can be applied:
- CustomGraph
- Gauge
- Table
- NOC
- SLA
- BigNumber
- Pie Chart
- Alert list widget
Note: For existing widgets, the filtered hosts are determined by the combination of hosts selected through property filters and those explicitly configured in the widget. If no hosts are found, no data is returned for the filter.
Creating Dynamic Filters
1. In LogicMonitor, navigate to Dashboards.
2. On the Dashboard page, select the Filters drop-down option.
3. Select + Add Record or select + on the right side.
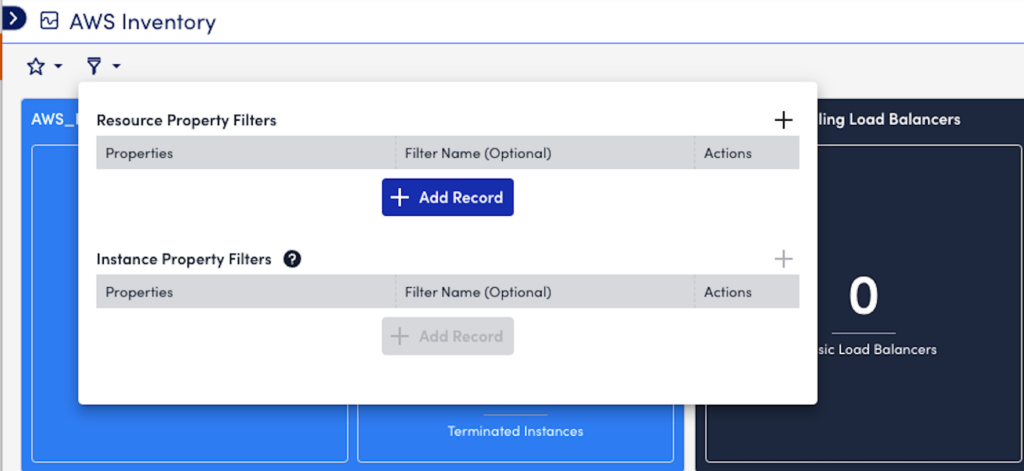
4. In the Property field, enter the required property name.
5. (Optional) In the Filter name field, enter the label name by which you want to save the property filter.
6. Select Apply.
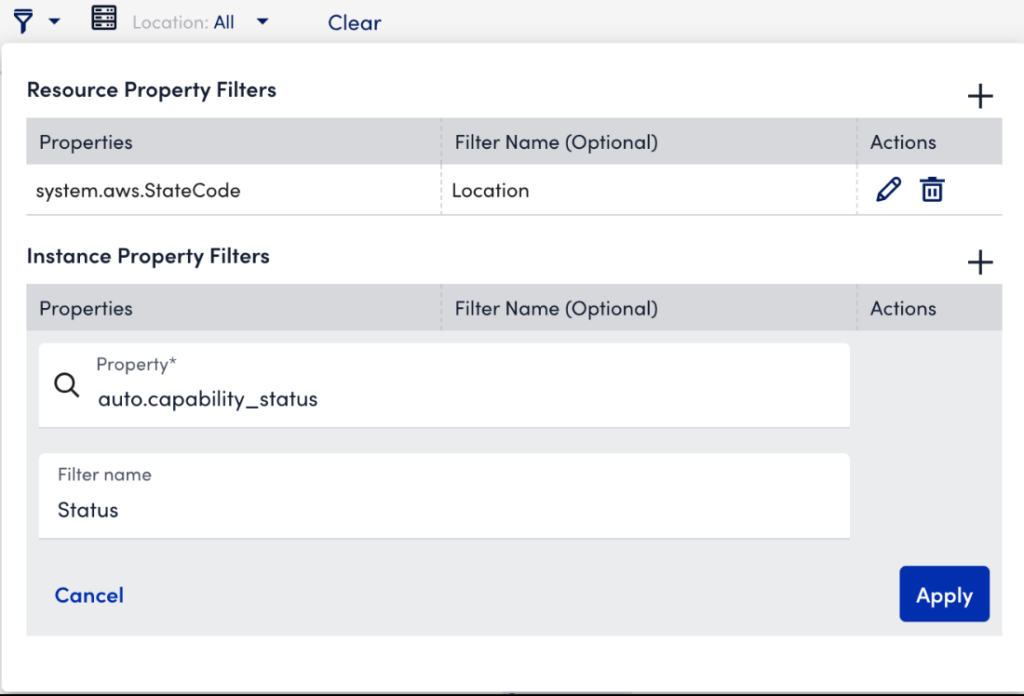
7. In the Instance Property Filters section, enter the required instance property name in the Property field.
Note: You must first apply the resource filter to enable the Instance Property Filters.
8. (Optional) In the Filter name field, enter the label name you want to see in the dashboard property filter.
9. Select Apply.
In addition, Instance Property Filters are available only for the following widgets:
- CustomGraph
- PieChart (excluding Resource Count)
- Gauge
- BigNumber (excluding Resource Count)
- Custom Table
- Dynamic Table
Note: Click anywhere on the UI to exit the Add Property dialog box.
10. (Optional) Select the Include or Exclude options to refine the search further.
By default, filters include results based on the selected values for each property. Select the Exclude toggle in the Filter By list menu to exclude results based on selected property values. This displays all resources except those where the filter values exist for the given property. This option also supports wildcard characters.
11. Select Clear to remove all the filters from the field.
Note:
-
You can filter using asterisk * wildcard to match property values by selecting Use* Wildcard option. Currently, only the asterisk wildcard is supported for filtering properties.
For example, filtering for Region: eu*, us*1, *2, *central* returns the following:
Regions that start with “eu”
Regions that start with “us” and end with “1”
Regions that end with “2”
Regions that contain “central”
-
In addition, saved filters support only the asterisk (*) wildcard character for refining searches.
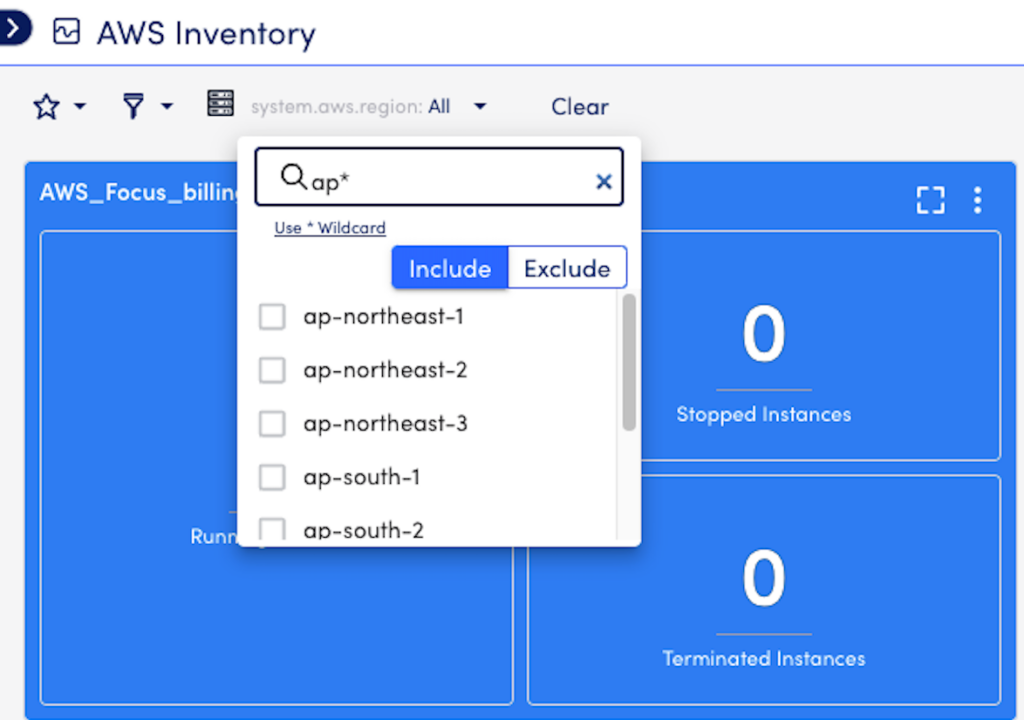
12. Select the required filter options from the set filters to view the required results.
Note: Using dynamic filters, you can now filter dashboards with inherited resource group properties.
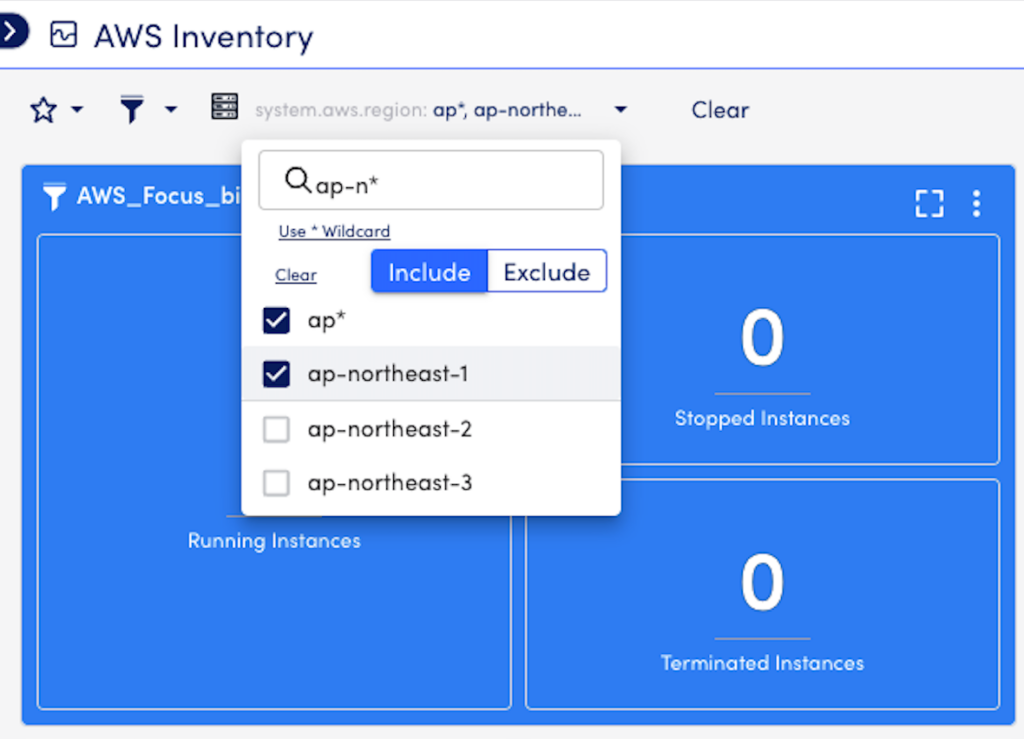
Note: The set filters are not saved for future views. The filters will not be displayed once you refresh or close the page.
13. Select Saved Views to save the filter for future views.
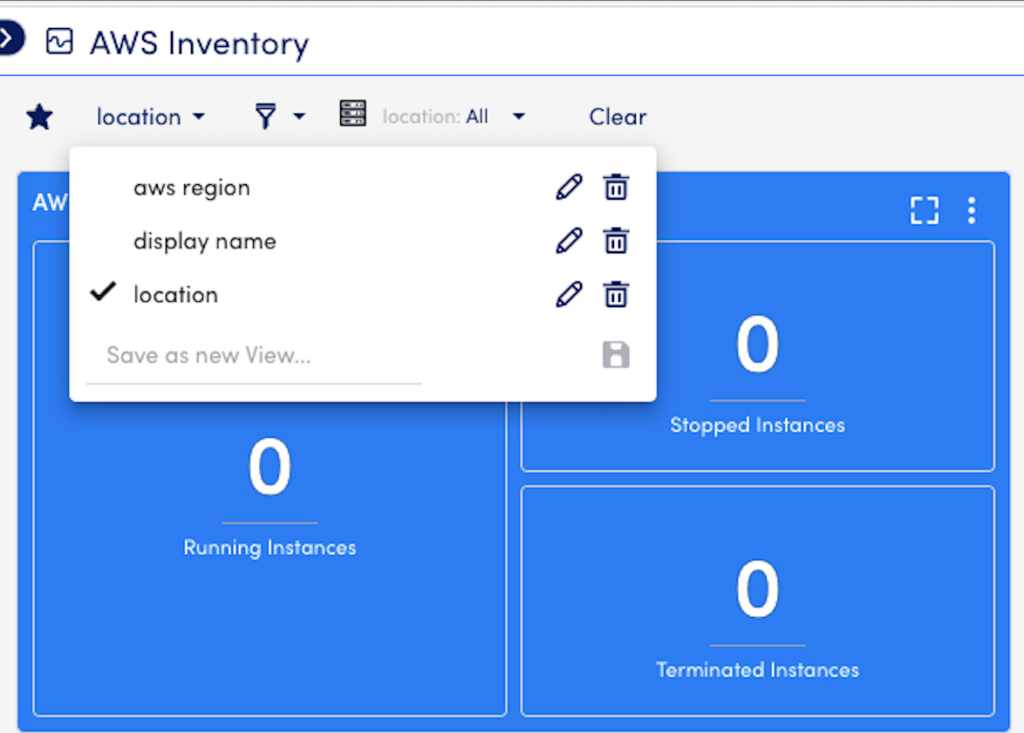
Note: Currently, only asterisk * wildcard character is supported for Saved Views.
Copying Dashboard URL with Applied Filters
You can copy and share the dashboard URL with applied filters.
- Log into the LogicMonitor portal and navigate to Dashboards > select the required dashboard.
- On the selected Dashboard, select the required resource properties filter from the Filters drop-down and select Apply.
- On the upper right corner, select Overflow > Copy Dashboard URL.
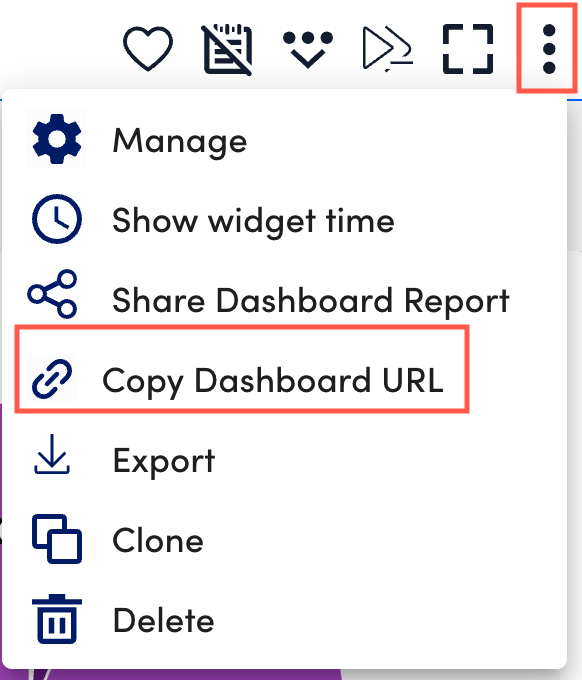
You can share the dashboard URL with or without applied filters. The dashboard URL displays the exact view from when the URL was generated.
Note: The Dashboard URL gets copied with the exact customization and the selected time range.
Appendix
Modular Panels
- Navigate to Dashboards > Add Widgets.
- On the Add Widgets panel, select Overflow > select the required options.
There are three options for adding widgets to the Dashboards:
- Dock bottom
- Dock right
- Pop-out
