v.126 Release: New UI for the Alerts Page
Last updated on 14 September, 2022Rolling out through the middle of October, LogicMonitor v.126 brings phase one of our new UI rollout to fruition, as well as offers new out-of-the-box monitoring for AWS Neptune, Cisco Firepower Chassis, and more.
IN THIS RELEASE:
Release Highlight: New UI for Alerts Page
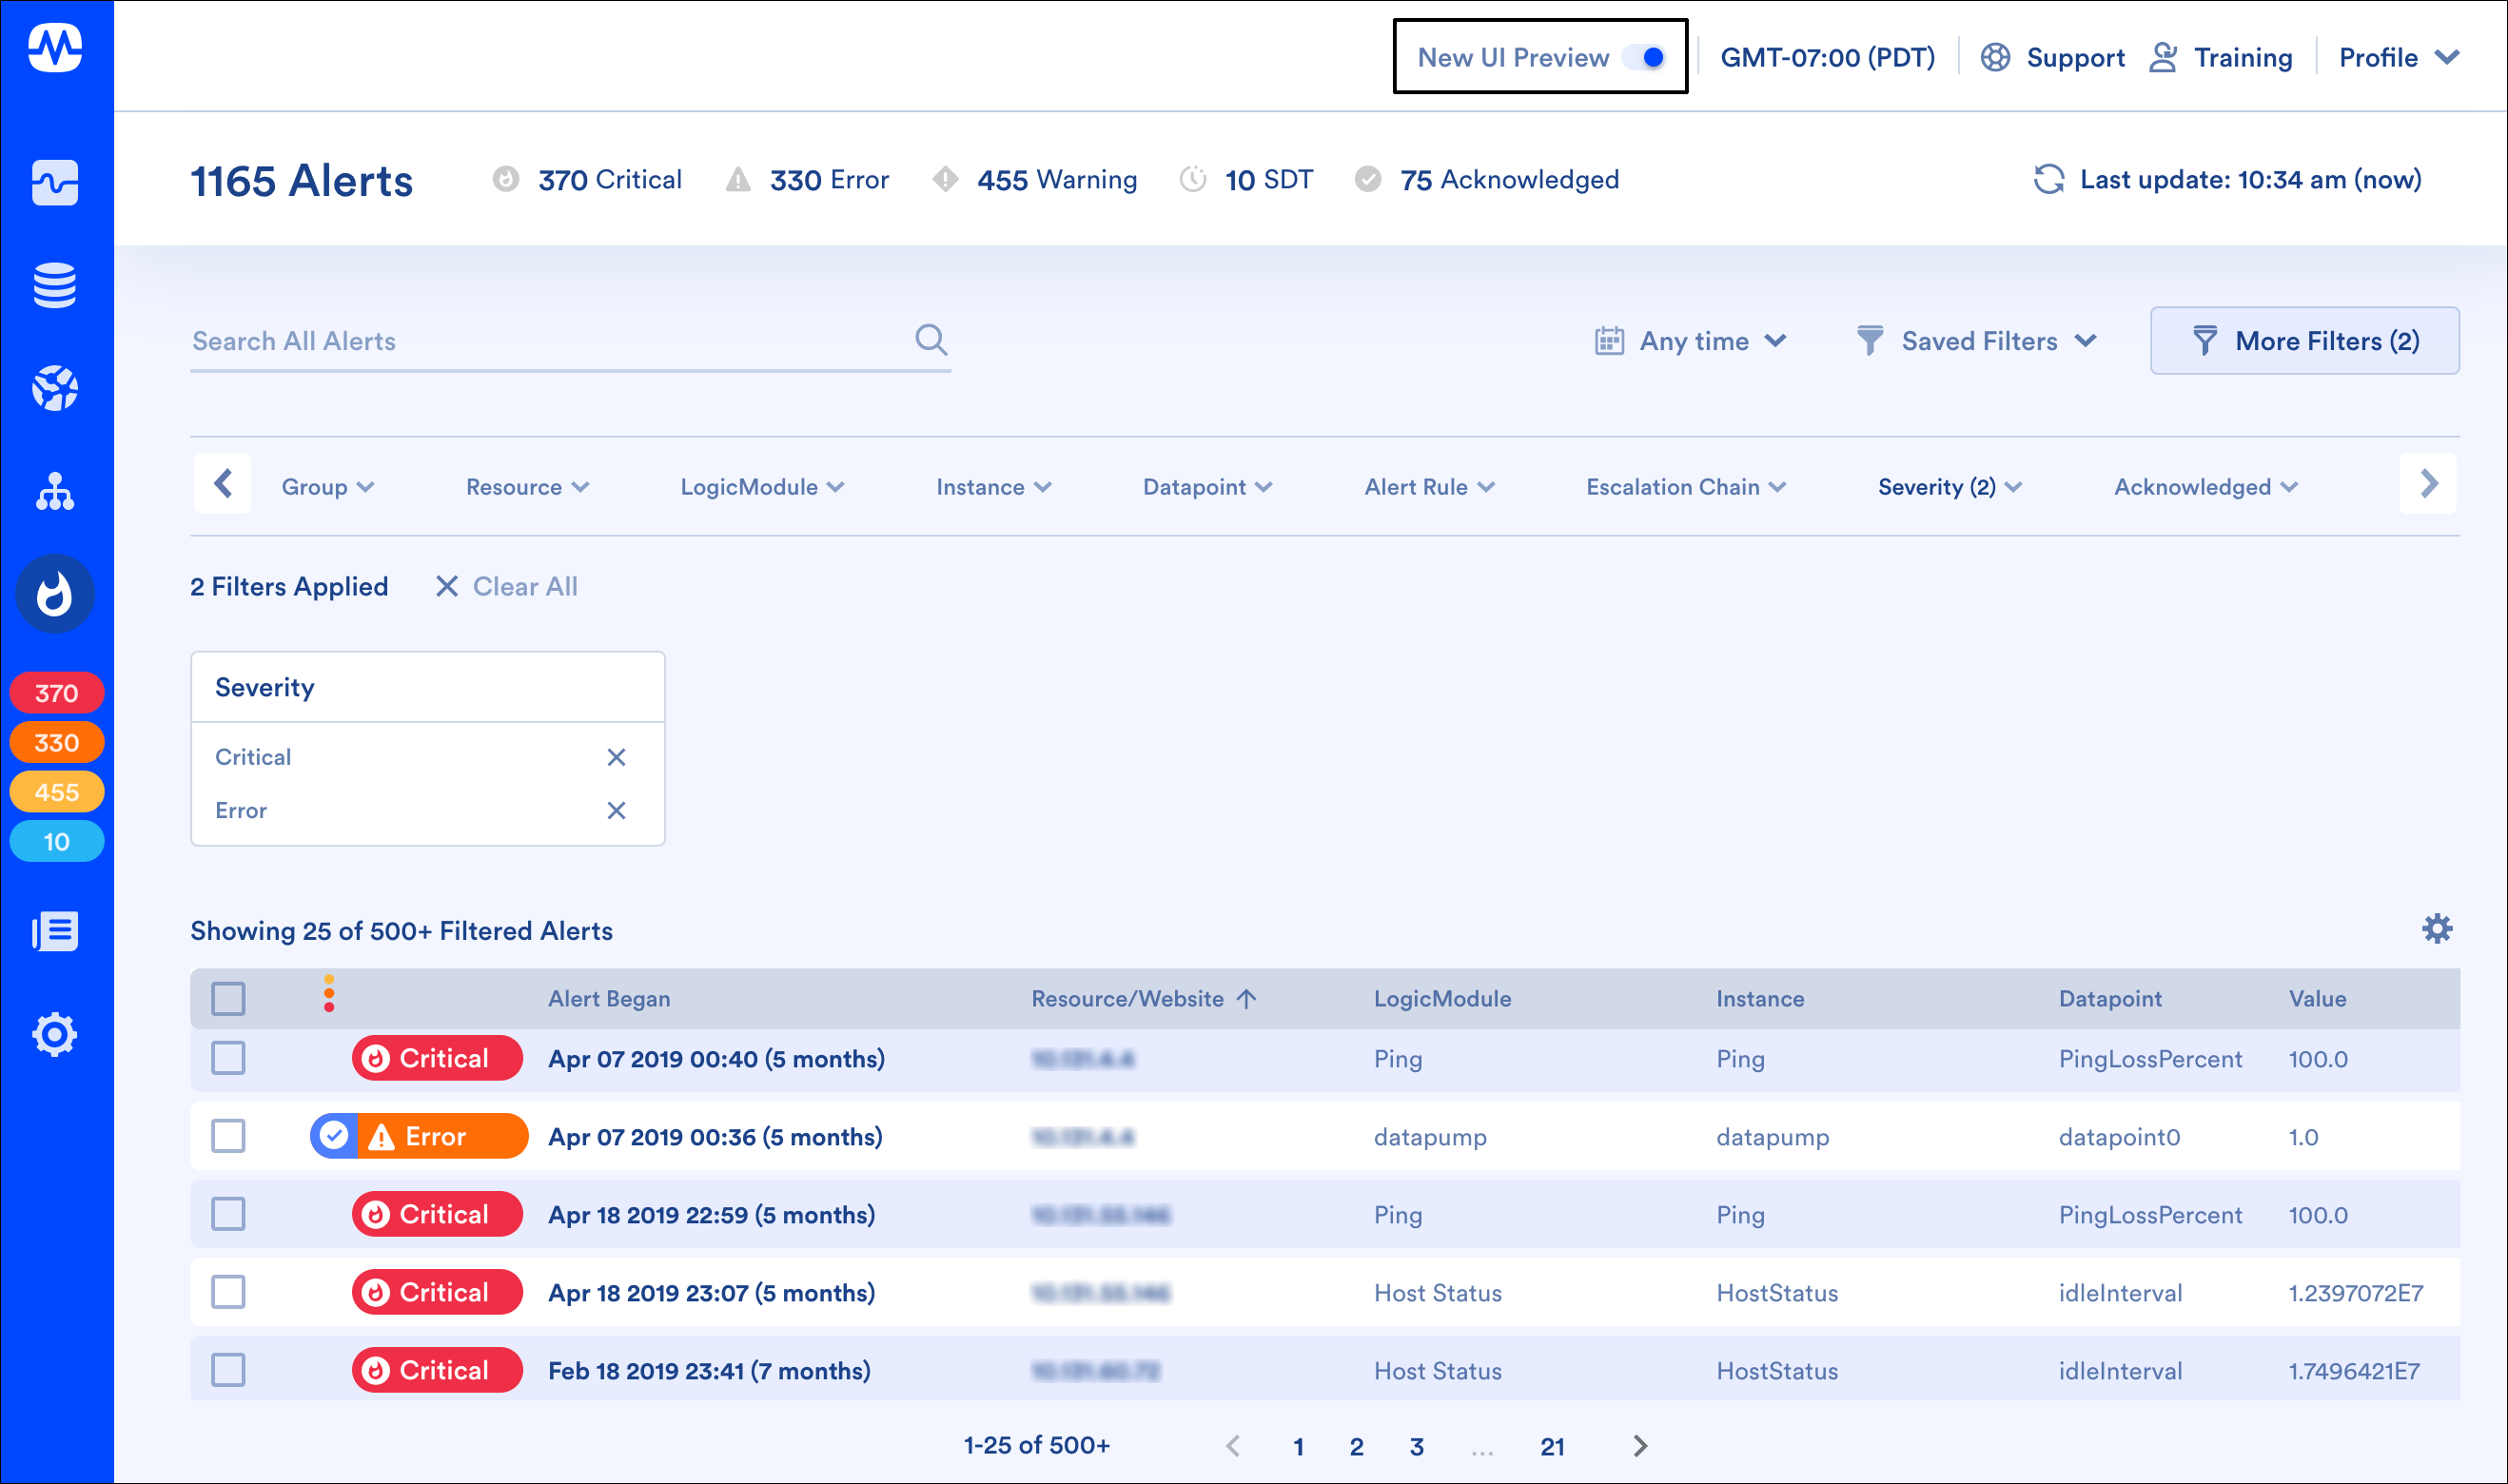
LogicMonitor is rolling out a brand new UI across the platform. On October 17, the Alerts page will become the first area of the platform to feature the new look and more intuitive user experience.

The “New UI Preview” slider, highlighted here, allows you to toggle between the old and new UI. This preview functionality will be available for six weeks, ensuring there is adequate time for you to experiment with the new UI and adapt internal workflows before the old Alerts page UI is retired.
In addition to a more intuitive, efficient and attractive UI/UX, several new features and feature enhancements are delivered with the new Alerts page:
- More powerful filtering
- Improved process for alert acknowledgment and SDT
- New alert table settings
For a detailed overview of the new Alerts page, see Managing Alerts from the Alerts Page.
Note: Due to front-end compatibility issues, security risks, and maintenance costs, the new Alerts page does not support Internet Explorer 11. If you currently use IE11 to access the LogicMonitor platform, we strongly recommend that you move to a supported LogicMonitor browser as soon as possible to avoid any disruptions in functionality.
New Monitoring Coverage
Upon your account’s upgrade to v.126, import our newest LogicModules from the LogicMonitor repository to increase your monitoring coverage.
- AWS MSK Broker (Paid Tier) – 1 DataSource
- Monitors non-default (paid) metrics for Amazon MSK at the PER_BROKER level as reported by CloudWatch. Intended to be used in conjunction with the existing AWS MSK Broker DataSource. Metrics collected fall under the “Paid tier” metrics, as outlined on the Amazon CloudWatch pricing page. This DataSource is disabled by default to prevent unnecessary charges for API calls.
- AWS Neptune – 1 DataSource
- Added discovery and monitoring for AWS Neptune graph databases.
- Azure SQL Database (Managed Instances) – 1 DataSource
- Added discovery and monitoring for SQL Database managed instances.
- Cisco Firepower Chassis Manager – 6 DataSources, 1 PropertySource
- Comprehensive monitoring for the Firepower Chassis Manager. See Cisco FirePower Chassis Manager Monitoring for details on this new monitoring package.
- Cisco SB & Cisco SMB – 2 SNMP SysOID maps
- SysOIDS 1.3.6.1.4.1.9.6.1 and 1.3.6.1.4.1.9.6.2 will assign “CiscoSB” and “CiscoSMB” respectively to Cisco SG300- and SG350- series switches.
- Dell EMC Avamar – 8 DataSources, 1 PropertySource
- Comprehensive monitoring of EMC Avamar’s client backup activities, checkpoints, client dataset configurations, and more. See Dell EMC Avamar Monitoring for details on this new monitoring package.
- GCP Pub/Sub Topic – 1 DataSource
- Added discovery and monitoring for Google Cloud Platform PubSub topics.
- Infoblox – 12 DataSources, 1 PropertySource, 2 SNMP SysOID Maps
- Comprehensive monitoring of the Infoblox DDI solution via SNMP. See Infoblox Monitoring for details on this new monitoring package.
Other v.126 Enhancements
Graphing
- Incorrect scaling of forecast graphs. Forecast graphs weren’t scaling by units of 1024 when such scaling was enabled in the DataSource graph definitions. This has been corrected.
LM Cloud
- Currency configuration for Microsoft Azure billing data. The Billing tab available from the Azure account management dialog now supports the configuration of country/region. Initially defaulting to “USA”, the value of this configuration adjusts billing currency.
LM Container
- Collector image configuration. Three new options have been added to LogicMonitor’s Kubernetes integration that allow for configuration of the Collector image used. You may find this useful when using a version other than the latest Collector version and/or when you require local images to be used during installation.
LogicModules
The following LogicModules have been updated. Upon your account’s upgrade to v.126, please import these latest versions from the LogicMonitor repository for enhanced monitoring operations.
- addERI_Cisco – 1 PropertySource
- Added support for Cisco IOS software, c7600
- addERI_PaloAlto – 1 PropertySource
- Applied fix to topology namespace
- AWS MSK (Broker | Cluster) – 2 DataSources
- Added metrics and graphs for ZooKeeper Session State
- Cisco IOS – 1 ConfigSource
- Added support for parser view
- EMC LUN NaviSec CLI – 1 DataSource
- Applied fix to is_fault datapoint to ensure proper regex matching
- Fujitsu Eternus (Controller Modules | RAID Groups | Volumes) – 3 DataSources
- Major improvements to pattern matching against CLI output
- Linux_SSH_Info – 1 PropertySource
- Expanded auth JSch support for CentOS distributions
- Meraki MR Interfaces – 1 DataSource
- Added access point matching support for cloud managed APs
- Microsoft SQL Server Databases – 1 DataSource
- Improved exception handling in AD script
- NetApp RAID – 1 DataSource
- Changed the toLong() expression to a toBigInteger() expression in order to handle larger values in collection script
- NetApp Logical Interfaces – 1 DataSource
- Applied fix to collection script for proper collection of status datapoints; minor graph improvements
- WinExchange Services – 1 DataSource
- Added filter to ensure Hyper-V services aren’t displayed for SQL Server hosts.
- Veeam Backup Jobs – 1 DataSource
- Replaced spaces with underscores in wildvalue to ensure proper collection
- VMware vCenter VM Performance – 1 DataSource
- Applied minor fix to address incorrect datapoint usage