LogicMonitor seeks to disrupt AI landscape with $800M strategic investment at $2.4B valuation to revolutionize data centers.

Learn More

Enabling Dynamic Thresholds for Datapoints

Last updated on 07 June, 2024

FEATURE AVAILABILITY: The dynamic thresholds feature is available to users of LogicMonitor Enterprise.

Overview

Dynamic thresholds represent the bounds of an expected data range for a particular datapoint. Unlike static datapoint thresholds which are assigned manually, dynamic thresholds are calculated by anomaly detection algorithms and continuously trained by a datapoint’s recent historical values.

When dynamic thresholds are enabled for a datapoint, alerts are dynamically generated when these thresholds are exceeded. In other words, alerts are generated when anomalous values are detected.

When dynamic thresholds are enabled, you’ll be automatically alerted to values that fall outside the algorithmically determined expected range (shaded in blue).

Dynamic thresholds detect the following types of data patterns:

  • Anomalies
  • Rates of change
  • Seasonality (daily/weekly) trends

Because dynamic thresholds (and their resulting alerts) are automatically and algorithmically determined based on the history of a datapoint, they are well suited for datapoints where static thresholds are hard to identify (such as when monitoring number of connections, latency, and so on) or where acceptable datapoint values aren’t necessarily uniform across an environment.

For example, consider an organization that has optimized its infrastructure so that some of its servers are intentionally highly utilized at 90% CPU. This utilization rate runs afoul of LogicMonitor’s default static CPU thresholds which typically consider ~80% CPU (or greater) to be an alert condition. The organization could take the time to customize the static thresholds in place for its highly-utilized servers to avoid unwanted alert noise or, alternately, it could globally enable dynamic thresholds for the CPU metric. With dynamic thresholds enabled, alerting occurs only when anomalous values are detected, allowing differing consumption patterns to coexist across servers.

For situations like this one, in which it is more meaningful to determine if a returned metric is anomalous, dynamic thresholds have tremendous value. Not only will they trigger more accurate alerts, but in many cases issues are caught sooner. In addition, administrative effort is reduced considerably because dynamic thresholds require neither manual upfront configuration nor ongoing tuning.

Training Dynamic Thresholds

Dynamic thresholds require a minimum of 5 hours of training data for DataSources with polling intervals of 15 minutes or less. As more data is collected, the algorithm is continuously refined, using up to 15 days of recent historical data to inform its expected data range calculations.

Daily and weekly trends also factor into dynamic threshold calculations. For example, a load balancer with high traffic volumes Monday through Friday, but significantly decreased volumes on Saturdays and Sundays, will have expected data ranges that adjust accordingly between the workweek and weekends. Similarly, dynamic thresholds would also take into account high volumes of traffic in the morning as compared to the evening. A minimum of 2.5 days of training data is required to detect daily trends and a minimum of 9 days of data is required to detect weekly trends.

Enabling Dynamic Thresholds

As discussed in the previous section, dynamic thresholds require a minimum of 5 hours of data for operation. This means that this feature must be enabled for 5 hours  and longer if polling intervals are less frequent than every 15 minutes before becoming operational. During this startup time period, alerts will continue to be routed as normal based on static datapoint thresholds (assuming static thresholds are in place).

Similar to static datapoint thresholds, there are multiple levels at which dynamic thresholds can be enabled:

  • Global level–Dynamic thresholds enabled for a datapoint at the global DataSource level cascade down to every instance (across all resources) to which the DataSource is applied. This level is a good choice if (1) individual instances have different performance patterns (for example, servers that have different optimal CPU consumption rates may benefit from thresholds that dynamically adjust their specific consumption patterns) or (2) performance for the datapoint is important but there isn’t a reasonable static threshold that makes sense for all instances (for example, the number of connections or requests is expected to vary from instance to instance depending on load).
  • Resource group level–Dynamic thresholds enabled for a datapoint at the resource group level cascade down to all instances for all resources in the resource group (and its subgroups).
  • Resource DataSource level–If the instances and their parent instance groups do not have their own defined thresholds, then they inherit the threshold set at their resource datasource level. The threshold is applicable only to multi instance resource datasource.
    Note: You can create, update, and delete thresholds only on the LogicMonitor new UI. The LogicMonitor old UI allows you to only view the thresholds.
  • Instance group level–If the instances do not have their own defined thresholds, then they inherit the threshold set at their instance group level.
  • Instance level–Dynamic thresholds enabled for a datapoint at the instance level can be configured to apply to a single instance on a single resource, multiple instances on a single resource, or all instances on a single resource to which the DataSource is applied. This level is a good choice if you are looking to (1) reduce noise for one or more instances on a single resource that don’t follow the same patterns as other instances to which that same DataSource applies (for example, perhaps you have one outlier database that is always opening more MySQL tables) or (2) experiment with dynamic thresholds on a subset of infrastructure as a starting point.

Dynamic thresholds cascade down from the global DataSource level. However, if other dynamic threshold configurations are encountered at deeper levels in the Resources tree, those deeper configurations will override those found at higher levels. For example, dynamic thresholds set at the resource group level will override those set at the global DataSource level. Similarly, dynamic thresholds set at the instance level will override those set at the resource group level.

The following table illustrates the set of threshold configurations that are used when evaluating a datapoint. When interpreting the table, assume the following conditions:

  • The datapoint being evaluated belongs to DataSource F
  • The datapoint being evaluated resides in Instance A
  • Instance A resides in a resource that is a member of Resource Groups D and E
  • Resource groups D and E are siblings on the Resources tree. The Resource Group D was created first followed by the Resource Group E
  • Instance A resides in the Instance Group B
  • DataSource F is applied on a resource and is mapped with Resource Datasource C
Threshold Configurations Present Across Various Levels Configurations that Take Precedence for the Datapoint on Instance A
Instance A Instance Group B Resource DataSource C Resource Group D Resource Group E DataSource F
No No No No No Yes The configurations set for the global DataSource F definition is inherited and applied.
No No No No Yes Yes The configurations set for the Resource Group E is inherited and applied.
No No No Yes No Yes The configurations set for the Resource Group D is inherited and applied.
No No No Yes Yes Yes The configurations set for the Resource Group D is inherited and applied. (When a resource belongs to two sibling resource groups, the configurations of the resource group that was created first, in this case the Resource Group D, take precedence.)
No No Yes Yes No Yes The configurations set for the Resource DataSource C is inherited and applied.
No Yes Yes No Yes Yes The configurations set for the Instance Group B is inherited and applied.
Yes Yes Yes Yes Yes Yes The configurations set for the Instance A is applied.

Note: The number of dynamic thresholds allowed per portal is limited to eight per total number of permitted monitored resources. This limit is an aggregate limit, enforced at the account level, not the per-resource level. For example, if your account permits monitoring of up to 100 total resources (this includes all monitored devices, cloud and Kubernetes resources, and services), then 800 total dynamic thresholds are permitted across your portal, applied in any manner you see fit. This total represents the number of times dynamic thresholds are potentially evaluated, meaning that if a dynamic threshold, even if only configured once, is inherited across multiple instances, each instance contributes to the total. For visibility into current usage and limit, navigate to Settings | Account Information.

Enabling at the Global Level

As a general rule, global enabling of dynamic thresholds is recommended when a majority of the instances in your infrastructure will benefit. Global-level enablement for dynamic thresholds takes place in the DataSource definition.

To enable dynamic thresholds for a datapoint at the global level:

  1. Open the DataSource definition, either by navigating to Settings | DataSources or by clicking the Edit Global Definition hyperlink that is available when viewing DataSource or instance data from the Resources tree.

    Note: The DataSource editor available from the Exchange page does not currently support dynamic threshold configuration.

  2. From the edit view of the DataSource definition, you’re able to view and edit all datapoints associated with the DataSource. Find the datapoint for which you want to enable dynamic thresholds, click its manage icon, and, from the Edit Datapoint dialog, toggle the Dynamic Thresholds slider to the right.
    Enabling dynamic thresholds at the DataSource level

    Note: You may also see static thresholds in place for the same datapoint. Static thresholds and dynamic thresholds can be used in conjunction with one another, as discussed in Assigning Both Static and Dynamic Thresholds to a Datapoint.

  3. For each alert severity level, you can choose to have dynamic thresholds trigger alerts, suppress alerts, or both:
    • Check the Trigger alerts option to enable dynamic thresholds to trigger alerts when datapoint values fall outside of the expected range.
    • Check the Suppress notification within the band option to automatically suppress alert notification routing for alerts that are triggered by static thresholds, but do not fall outside the bounds of the expected range. Alert notification suppression behavior only occurs if static thresholds are also set for the alert severity level. For more information on alert notification routing suppression, see the Assigning Both Static and Dynamic Thresholds to a Datapoint section of this support article.
  4. If you are using dynamic thresholds to trigger alerts, you can click the Advanced Configuration hyperlink to display the current alert conditions for each selected severity level.

    By default, LogicMonitor attempts to auto-determine the right range sensitivity for each severity, but you are able to make adjustments to the following advanced configurations:

    • The percentage of values returned during the consecutive polling intervals that must violate the dynamic threshold. For example, if 100% is set, all values returned must be anomalous in order for an alert to be triggered.
    • The number of band factors from normal performance at which the dynamic threshold should be set. This is similar in concept to a multiple of standard deviations from normal.
    • Whether alerting will occur on deviations from the upper bound of the dynamic threshold, the lower bound, or both.
    • Set maximum/minimum values for the dynamic threshold. If set, alerts are only generated if the metric value is above/below the defined threshold range. This is useful to avoid receiving anomaly alerts for resources where the metric value has changed abnormally, but is still within an expected range.
    • The duration of time for which the above conditions must be met. This duration is determined by multiplying the indicated number of polling intervals (known as the alert trigger interval) by the polling interval assigned to the DataSource (in the Collect Every field). This setting overrides the alert trigger interval set for static thresholds, but behaves in the same way. See Datapoint Overview for more information on the behavior of the alert trigger interval, as well as the alert clear interval which is used by both static and dynamic thresholds.
  5. Click Save to update and exit the datapoint settings.
  6. Be sure to click Save again to update the DataSource.

Enabling at the Resource DataSource Level

  1. On the Resources page, from the resources tree, select the datasource you want.
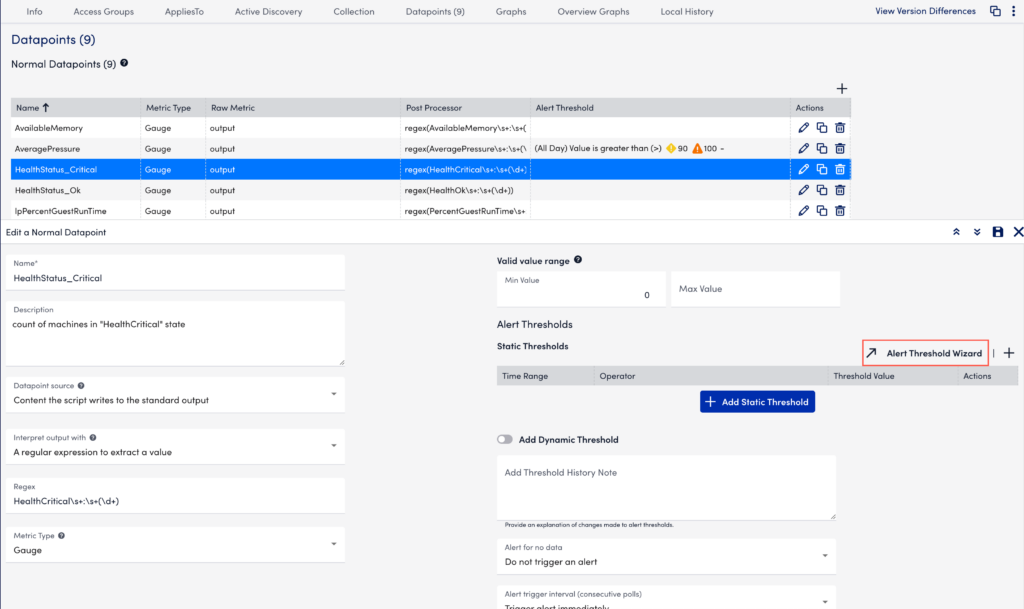
  2. Select the Alert Tuning tab and then from the datapoint table, select the datapoint you want.
  3. In the details panel, select the datapoint that you want to tune.

To add a new threshold and set alert tuning parameters to a resource datasource:

  1. Select the datapoint row in the table.
  2. In the details panel, select the Threshold tab.
  3. Select +, and then select Dynamic Threshold.
  4. Set Automatic or Manual from the drop-down.
  5. Specify the criteria when you want to trigger an alert and add the number of consecutive intervals after which a warning, error, or critical alert should be sent.
  6. Select Save to apply the settings.

Enabling at the Instance or Resource Group Level

Enabling dynamic thresholds at the instance or resource group level takes place on the Resources page. As highlighted next, there are different entry points, depending upon whether you are enabling dynamic thresholds for a single instance on a single resource, multiple instances on a single resource, or all instances in a resource group.

To enable dynamic thresholds for a datapoint at the resource group or instance level:

  1. Open the Resources page.
  2. To enable dynamic thresholds for:
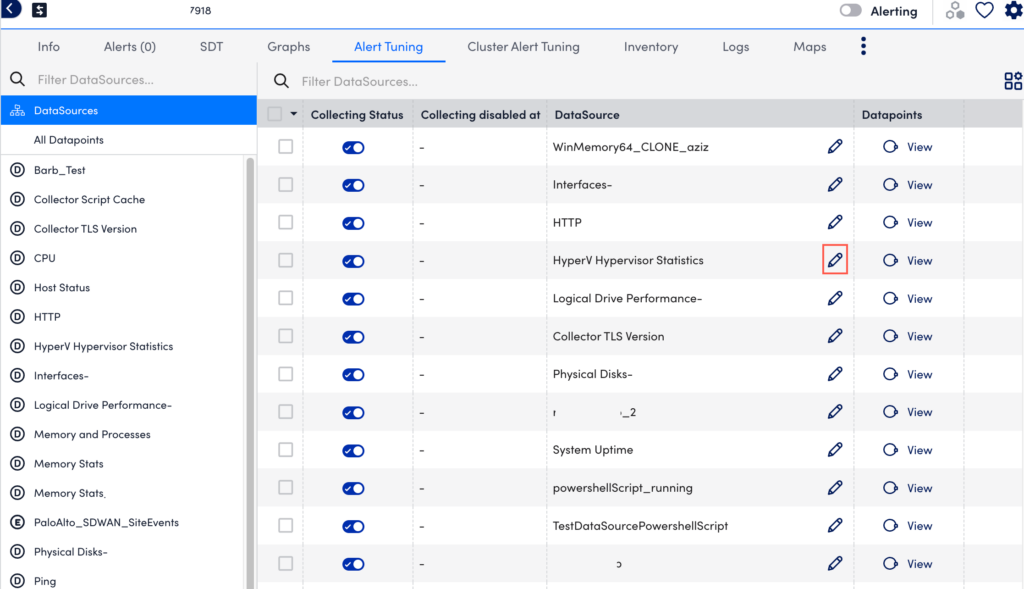
    • A single-instance Datasource (and thus a single instance), navigate to the DataSource in the Resources tree and open the Alert Tuning tab.
    • A single instance of a multi-instance DataSource, navigate directly to the instance itself in the Resources tree and open the Alert Tuning tab.
    • All instances of a multi-instance DataSource, navigate to the DataSource in the Resources tree and open the Alert Tuning tab.
    • All instances in an instance group, navigate to the instance group in the Resources tree and open the Alert Tuning tab.
    • All instances in a resource group, navigate to the resource group in the Resources tree, open the Alert Tuning tab, and, from the list of all DataSources that apply to one or more resources in the group, locate and expand the DataSource to which the datapoint belongs.
  3. Locate the datapoint for which you want to enable dynamic thresholds and click the pencil icon found in the “Dynamic Threshold” column.
  4. This opens the Threshold dialog. By default, instances are set to inherit the dynamic threshold settings assigned to their parent (for example, settings from the global DataSource are automatically inherited). To override these at the current level, select “Custom” from the dropdown menu.
    Enabling dynamic thresholds at the instance level

    Note: You may also see static thresholds in place for the same datapoint. Static thresholds and dynamic thresholds can be used in conjunction with one another, as discussed in Assigning Both Static and Dynamic Thresholds to a Datapoint.

  5. For each alert severity level, you can choose to have dynamic thresholds trigger alerts, suppress alerts, or both:
    • Check the Trigger alerts option to enable dynamic thresholds to trigger alerts when datapoint values fall outside of the expected range.
    • Check the Suppress notification within the band option to automatically suppress alert notification routing for alerts that are triggered by static thresholds, but do not fall outside the bounds of the expected range. Alert notification suppression behavior only occurs if static thresholds are also set for the alert severity level. For more information on alert notification routing suppression, see the Assigning Both Static and Dynamic Thresholds to a Datapoint section of this support article.
  6. If you are using dynamic thresholds to trigger alerts, you can click the Advanced Configuration hyperlink to display the current alert conditions for each selected severity level. By default, LogicMonitor attempts to auto-determine the right range sensitivity for each severity, but you are able to make adjustments to the following advanced configurations:
    • The percentage of values returned during the consecutive polling intervals that must violate the dynamic threshold. For example, if 100% is set, all values returned must be anomalous in order for an alert to be triggered.
    • The number of band factors from normal performance at which the dynamic threshold should be set. This is similar in concept to a multiple of standard deviations from normal.
    • Whether alerting will occur on deviations from the upper bound of the dynamic threshold, the lower bound, or both.
    • Set maximum/minimum values for the dynamic threshold. If set, alerts are only generated if the metric value is above/below the defined threshold range. This is useful to avoid receiving anomaly alerts for resources where the metric value has changed abnormally, but is still within an expected range.
    • The duration of time for which the above conditions must be met. This duration is determined by multiplying the indicated number of polling intervals (known as the alert trigger interval) by the polling interval assigned to the DataSource (in the Collect Every field). This setting overrides the alert trigger interval set for static thresholds, but behaves in the same way. See Datapoint Overview for more information on the behavior of the alert trigger interval, as well as the alert clear interval which is used by both static and dynamic thresholds.
  7. If you are configuring dynamic thresholds for a single instance only, you’ll see an anomaly detection graph displayed immediately under the dynamic threshold configurations. This graph is intended to give you an idea of the values that will trigger future alerts by displaying the expected range (dynamic thresholds) in place for the highest alert severity enabled, along with the datapoint’s recent performance.

    Note: Anomaly detection graphs are based on aggregated (resampled) data, so their renderings of graph coordinates and expected range bands may differ slightly from the expected range used to generate the alert. This visual discrepancy potentially increases as the graph’s time range increases because more resampling is required to fit the graph onto a finite screen size. For this reason, we recommend setting shorter time ranges when possible to minimize the amount of resampling required. For more information on anomaly detection graphs, see Anomaly Detection Visualization.

  8. Click Save & Close.

Managing Dynamic Threshold

Viewing Threshold History

When you add or update a threshold, the changes are captured and displayed under History. In the threshold history, you can view the following details:

  • Name of the user who made the changes
  • Date and timestamp
  • Nature of change – add or update

Viewing Threshold Hierarchy

Under the Parents tab of a datapoint, you can view the threshold hierarchy of a datapoint. You can view both static and dynamic threshold configured for a datapoint. The global level threshold is placed at the top and the order is: DataSource > Resource group > Resource DataSource > Instance group > Instance.

  1. Select the datapoint row in the table.
  2. In the details panel, select the Parents tab. Depending on the threshold configuration, the hierarchy is displayed.

Editing Threshold

  1. Select the datapoint row whose threshold you want to edit.
  2. In the details panel, select the Threshold tab.
  3. Select the threshold that you want to edit. The Edit Dynamic Threshold panel is displayed.
  4. Edit the threshold and select Save.

Deleting Threshold

  1. Select the datapoint row whose threshold you want to delete.
  2. In the details panel, select the Threshold tab.
  3. Select the threshold that you want to delete. The Edit Dynamic Threshold panel is displayed.
  4. Select the Delete Threshold icon. A pop up confirming deletion is displayed.
  5. Enter the threshold update note and select Delete.

Assigning Both Static and Dynamic Thresholds to a Datapoint

Dynamic thresholds (and their resulting alerts) are automatically and algorithmically determined based on the history of a datapoint. There is no requirement to additionally establish static thresholds for a datapoint for which dynamic thresholds are enabled.

However, the assignment of both static and dynamic thresholds for a single datapoint is possible—and desirable in the right use case. When both types of thresholds are set for a datapoint, alerting behavior becomes more flexible, supporting either—or both—of the following behaviors per datapoint:

  • Automatic generation of alerts when values fall outside of the expected warning, error, and/or critical alert severity ranges set for the datapoint.
  • Automatic suppression of alert notification routing for alerts triggered by the static thresholds in place for the datapoint IF the triggering value falls within the expected range of the dynamic thresholds assigned the same alert severity. For example, if a static threshold triggers an alert severity level of warning, but a dynamic threshold of the same alert severity level indicates the value is not anomalous (that is, it does not fall outside of its calculated expected range), the alert triggered by the static threshold is not subsequently routed. Regardless of whether alert notifications are routed or suppressed based on dynamic thresholds, the originating alert itself always displays within the LogicMonitor interface.

As a result of these two sets of behaviors (which can work independently or in cooperation with one another), dynamic thresholds can be used to:

  • Reduce alert noise in cases where static thresholds aren’t tuned well, while also alerting you to issues that aren’t caught by static thresholds. For this use case, static thresholds must be in place and dynamic thresholds must be configured to both suppress and trigger alerts.

    A good strategy for optimizing both sets of behaviors (trigger and suppression) is to enable dynamic thresholds for warning and/or error severity level alerts for a datapoint, while enabling static thresholds only for critical severity level alerts. This ensures that if static thresholds aren’t tuned well for less-than-critical alerts, alert noise is reduced and dynamic thresholds catch issues that aren’t caught by static thresholds. And for values that represent critical conditions, the static threshold will, without question, result in an alert.

  • Only reduce alert noise in cases where static thresholds aren’t (or can’t easily) be well tuned. For this use case, static thresholds must be in place and dynamic thresholds must be configured to suppress alerts.

    This is useful when there are different use cases for suppression and alert generation. For example, a percentage-based metric for which there is a very clear good and bad range may benefit more from suppression when it is not outside its expected range than from alert generation when it is deemed anomalous.

Note: When static and dynamic thresholds are both enabled for the same datapoint and alerts are triggered by both, the highest severity alert always takes precedence. If these alerts are triggered for the same severity, the alert triggered by the static threshold always takes precedence.

For more information on static thresholds, see Tuning Static Thresholds for Datapoints.

Viewing Alerts for Dynamic Thresholds

Alerts that have been generated by dynamic thresholds (or alerts whose notification deliveries have been suppressed by dynamic thresholds) display as usual in the LogicMonitor interface.

Alerts generated by dynamic thresholds will provide deviation details (expected range and deviation from expected range) in the alert description and graph, both found in the Overview tab.

Viewing alerts triggered by dynamic thresholds
Overview graphs include the range in which datapoint values are expected to fall (shaded in blue) and the ability to plot offsets that compare the current timeframe to values collected exactly 24 hours, one week, or 30 days ago. For more information on how the expected range is calculated or on using offsets, see Anomaly Detection Visualization

Anomaly Filter

When viewing alerts from the Alerts page or from the Alerts tab on the Resources page (or when configuring the Alert List widget or Alerts report), you can use the Anomaly filter to limit alert display to only those alerts that were triggered by dynamic thresholds. For more information on alert filters, see Managing Alerts from the Alerts Page.

Note: By default, the alert table does not display alerts that have been cleared. To see a historical account of all alerts triggered by dynamic thresholds, enable the cleared filter in conjunction with the anomaly filter.

Alerts Thresholds Report

The Alerts Thresholds report provides visibility into the datapoint thresholds set across your LogicMonitor platform. It reports on the thresholds in effect across multiple resources, including detailing thresholds that have been overridden and highlighting resources for which alerting has been disabled. To learn more about this report, see Alert Thresholds Report.

Note: If you’d like to see the resources/instances across your portal for which custom dynamic thresholds have been set, run this report with the the Only show custom thresholds option checked.

Best Practices

Next are some best practices to keep in mind when enabling dynamic thresholds:

  • Don’t enable dynamic thresholds for status datapoints (for example, datapoints that indicate up or down status) or datapoints that represent discrete values (for example, HTTP error codes).
  • If you generally know that certain good and bad ranges of a metric always hold true (for example, above 90% is always bad, below 90% is always good) use static thresholds. Dynamic thresholds are most useful when it is not possible or difficult to identify a general range across instances (for example, above 10MBs is bad for instance A, but acceptable for instance B).
  • Set dynamic thresholds globally (in the DataSource definition) if:
    • Individual instances have different performance patterns (for example, servers all consuming different amounts of CPU may benefit from thresholds that dynamically adjust to each of their specific consumption patterns).
    • Performance for the datapoint is important and there isn’t a reasonable static threshold that makes sense (for example, the number of connections or requests reported for a datapoint varies from instance to instance depending on load).
  • Set dynamic thresholds at the instance level if:
    • The goal is to reduce noise for an outlier instance that doesn’t follow the same patterns as other instances of the same DataSource (for example, one database that’s always opening more MySQL tables than others)
    • The goal is to experiment with dynamic thresholds on a small subset of infrastructure to start.
  • When using dynamic thresholds in combination with static thresholds, select the “Value” comparison method (which compares the datapoint value against a threshold) when configuring the static threshold, when possible. In some cases, the UI will prevent some operators, such as delta, from being selected when dynamic thresholds are in use to avoid conflict.
  • A good strategy for leveraging both static and dynamic thresholds in combination is to enable dynamic thresholds for warning and/or error severity level alerts for a datapoint, while enabling static thresholds only for critical severity level alerts. This ensures that if static thresholds aren’t tuned well for less-than-critical alerts, alert noise is reduced and dynamic thresholds catch issues that aren’t caught by static thresholds. And for values that represent critical conditions, the static threshold will, without question, result in an alert.
  • When determining which datapoints to enable dynamic thresholds for, consider generating an Alert Trends report or filtering the Alerts page to see which areas of your environment are producing the most noise.
In This Article