MongoDB Atlas Project Integration
Last updated on 27 August, 2024MongoDB Atlas is a database cluster service with options for AWS, GCP, and Azure. LogicMonitor can be integrated with MongoDB Atlas through the MongoDB and LM portals for all three of the cloud providers. This enables you to achieve visibility into your MongoDB Atlas managed clusters, alongside the rest of your LogicMonitor environment.
Requirements
- Create and configure a MongoDB Account. For additional information, see the MongoDB “Getting Started with Atlas” documentation.
- User permissions to a MongoDB Atlas project and project API key. For additional information, see the MongoDB “Create an API Key for a Project” documentation.
- To view metrics in the LogicMonitor Portal, a paid tier MongoDB Atlas database cluster must be running in the appropriate project.
Note: MongoDB Atlas Free Tier does not offer metrics. While the integration steps for LogicMonitor and MongoDB Atlas Free Tier can be completed, no data is visible in the Dashboard or associated monitoring pages.
Add the MongoDB Atlas Project to the LM Portal
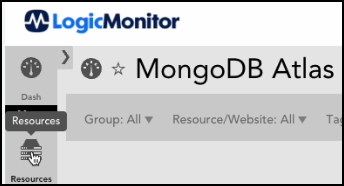
1. From the LM Portal home page, click Resources.
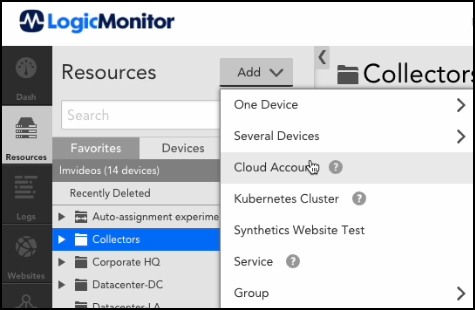
2. From the Resources page, click Add and select Cloud Account.
3. From the Cloud Integrations page, scroll to the MongoDB Atlas selection and click the Add button.
4. Enter a Name and optionally enter a Description. In the bottom right corner, click the Next: Permissions button.
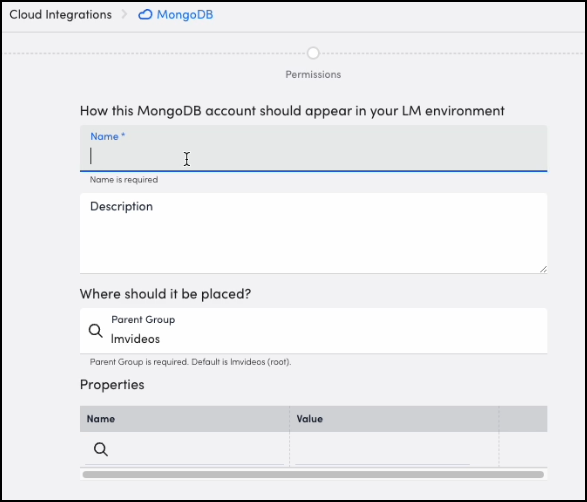
5. Enter the MongoDB Atlas Project API key pair.
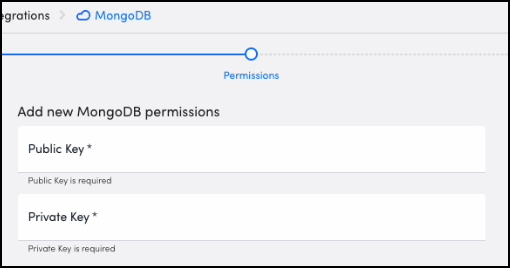
6. Click the Test Permissions and wait for the Success banner to appear.

7. Click the Add Service button.

The MongoDB Atlas project is now added to the LM Portal for monitoring. If the Atlas cluster is within the Atlas project, each cluster node is monitored individually. MongoDB Atlas creates three cluster nodes by default.
MongoDB Atlas Resource Monitoring
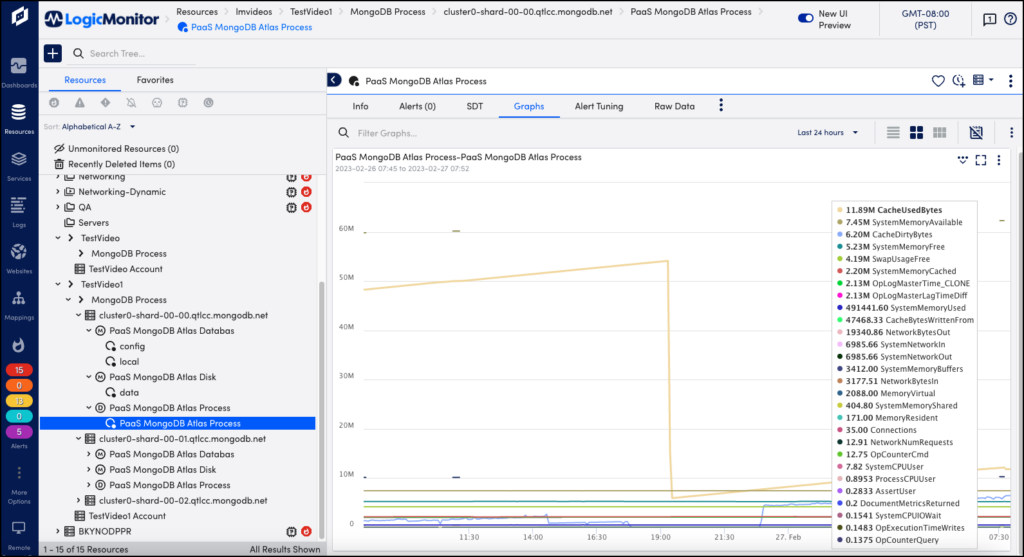
Monitoring can be viewed through the LM Resource Tree selections or configured for the dashboard. Pictured below is a Process monitoring graph for Shard 0. A default MongoDB Atlas cluster has three shards, which are listed in the Resource Tree pictured on the left, below. Shards, also known as nodes, are listed and indexed as 0, 1, and 2. The Atlas clusters are elastic, so additional Shards might be added as workload increases. Each Shard has monitoring statistics related to four areas: Database config (overall cluster), Database local (single shard or node), Disk, and Process. The Database areas are specific to MongoDB, while the Disk and Process areas are related to the Server. Each of the four areas have several different tabs, including Info, Alerts, SDT, Graphs, and Raw Data.
If the mouse is hovered over the line portions of the graph, the graph key appears. Pictured below on the right. There are approximately twenty-eight monitoring factors in the Process graph, including ProcessCPUUser and SystemCPUUser.
