Website Alerts
Last updated on 08 May, 2023Overview
LogicMonitor can raise alerts on your websites after a specified number of checks fail at one or more locations. How and when alerts are triggered is configured on a per-website basis.
Configuring Alert Trigger Settings
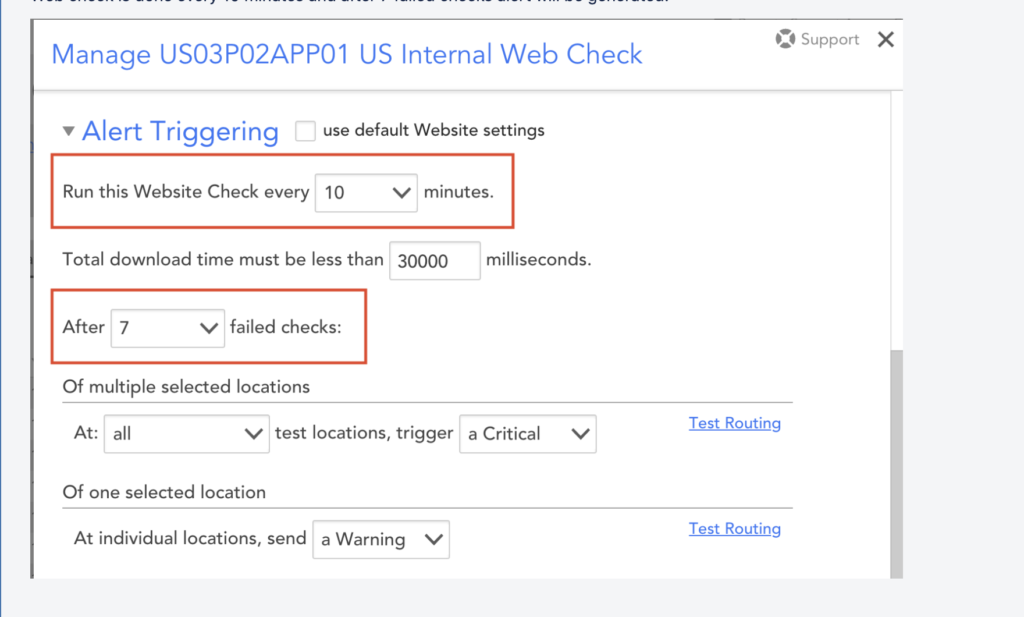
Alert trigger settings are configured from the “Alert Triggering” section of the Add or Manage dialog for a Web Check or Ping Check, as shown in the following graphic.

The settings for triggering alerts vary slightly depending upon whether you are adding a Web Check or Ping Check, as well as whether the Web Check or Ping Check is coming from an external checkpoint or internal Collector. (For instructions specific to the type of check you are setting alerts for, see Managing Alerts from the Alerts Page.)
Following is the calculation method for websites:
The minimum time for which the checks must fail to generate an alert is calculated as follows:
(Number of failed checks – 1) x (website_checks_every_time = 10 minutes)
For example:
If you have configured the website to generate an alert after 7 consecutive failed checks, an alert is sent after (7-1) x 10= 60 minutes. So when the checks fail continuously for a minimum of 60 minutes, an alert is generated. Also, when the checks pass for a minimum of 60 minutes, the alert is cleared
Viewing Website Alerts
There are two locations within the LogicMonitor interface in which website alerts can be viewed:
- Alerts page. The Alerts page displays ALL active alerts for your LogicMonitor account, including, but not limited to website alerts. (For more information on this page, see Managing Alerts from the Alerts Page.)
- Alerts tab. Website alerts are also displayed on the Alerts tab, shown next, for a particular website check or a website check group (if the group contains a check in alert). The Alerts tab essentially provides a filtered view of the Alerts page, pre-filtered to display active alerts only for the selected entity. Although the Alerts tab for websites does have some filters unique to websites, the functionality is largely identical to that of Alert tabs found throughout the LogicMonitor interface (e.g. Alert tabs for specific devices, instances, EventSources, etc.). (For more information on Alert tab functionality, see Alerts Tab.)
Customizing Website Alert Messages
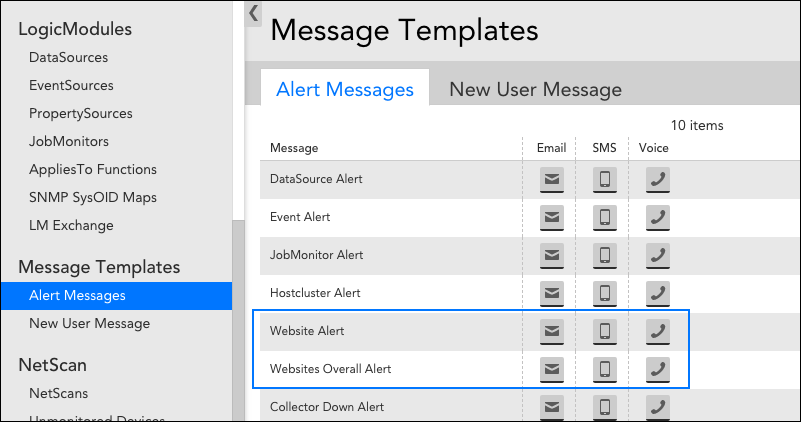
For those website alerts that you choose to have delivered via alert rules (rather than just displaying as alerts within the LogicMonitor interface), you can globally customize the messages that are sent. Message templates for website alerts are available at Settings | Message Templates | Alert Messages. As shown (and discussed) next, there are two website alert templates.

- Website Alert. This template controls the notifications for alerts triggered based on the checks at individual locations.
- Website Overall Alert. This template controls the notifications for alerts triggered based on the checks at multiple locations.
Note: For more information on customizing alert message templates, see Alert Messages.
Note: Alert notification messages support tokens. To view those tokens available for website alerts, see Tokens Available in LogicModule Alert Messages.