


Rolling out through the middle of September, LogicMonitor v.125 brings significant enhancements to topology mapping, as well as new monitoring for Microsoft Exchange and EMC Unity. Also recently released is a new version of the powerful LogicMonitor ServiceNow CMDB Integration application.
IE11 support to be discontinued
As you may be aware, LogicMonitor is rolling out a new UI over the coming months. Due to front-end compatibility issues, security risks, and maintenance costs, this new UI will not support Microsoft Internet Explorer 11. The Alerts page will be the first area of the interface to receive the new UI (targeted for release in October).
If you currently use IE11 to access the LogicMonitor platform, we strongly recommend that you move to a supported LogicMonitor browser as soon as possible to avoid any disruptions in platform functionality.
Release Highlight: Topology Mapping Enhancements
Significant enhancements have been made to the methods used by topology mapping to establish relationships among devices. These new methods are extensible, allowing topology mapping coverage to grow in a more predictable and scalable manner.
ERI Priority
The concepts of source, category, and priority are now present in the generation of ERIs (external resource ID). The addition of these tags allows LogicMonitor to determine which generated ERI takes precedence, based on confidence level. Previously, an existing ERI could be overwritten by a new one with no evaluation rules in place to determine which ERI should take precedence.
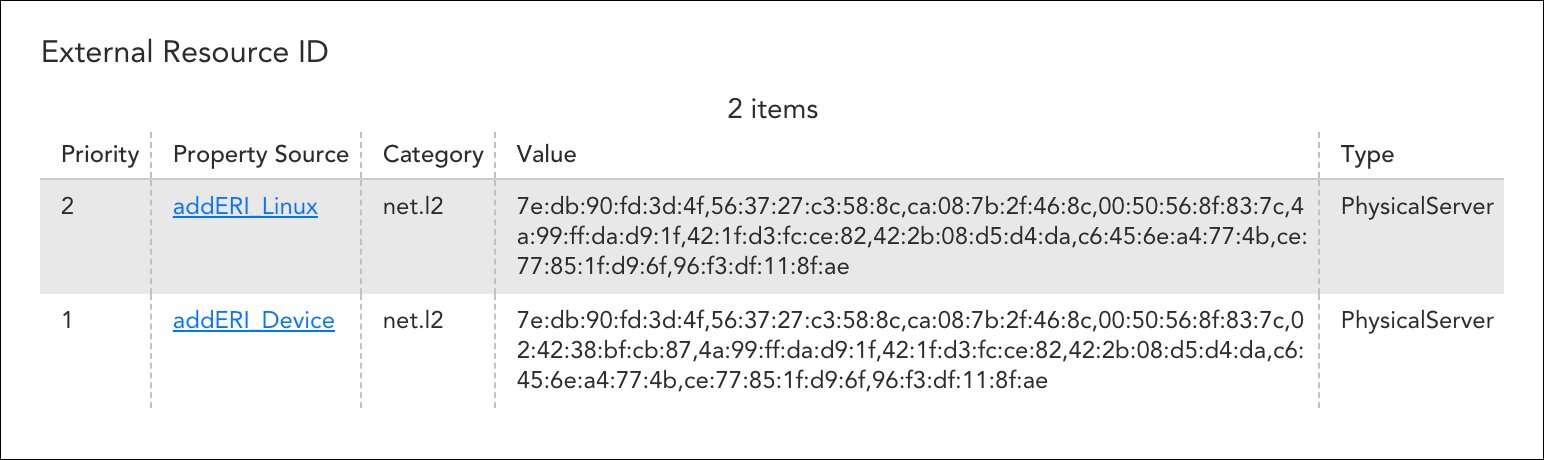
All generated ERIs, along with the individual keys that make up each ERI, now display on the resource’s Info tab to provide context (i.e. the PropertySource that generated the ERI, as well as the category of the ERI). The ERI with the highest assigned priority number is the one that takes precedence.
Get the Enhancements
In order to implement these ERI enhancements, you’ll need to update/import all PropertySources, TopologySources, and DataSources relevant to your topology mapping environment. Visit the v.125 LogicModule Releases section of these release notes for a complete list of all new and updated LogicModules. And, for more information on these enhancements and other aspects of topology mapping, see Topology Mapping Overview.
Highlight: ServiceNow CMDB Integration Application Version 1.1.x
Earlier this year, LogicMonitor announced the availability of its out-of-the-box integration with ServiceNow CMDB. This integration app features bi-directional data synchronization between ServiceNow CMDB and LogicMonitor to ensure a reliable and up-to-date CMDB, and enriched alerting data for quicker mean-time-to-resolution for critical incidents.
Recently, we’ve released a new version (1.1.x) of this integration app, which offers several enhancements, highlighted next.
Compliance with New York Release
The newest version of our LogicMonitor ServiceNow CMDB Integration app (along with our built-in incident management alert integration) is certified as compliant with ServiceNow’s upcoming New York release. Our apps are ready, day one, for your upgrade to New York!
New Update Set: Auto-Balanced Collector Groups
A new Update Set is available for the latest version of this app. This Update Set supports the provisioning of devices to Auto-Balanced Collector Groups (previously devices could only be assigned to one specific Collector). For more information on getting and configuring this Update Set, see our GitHub Repository.
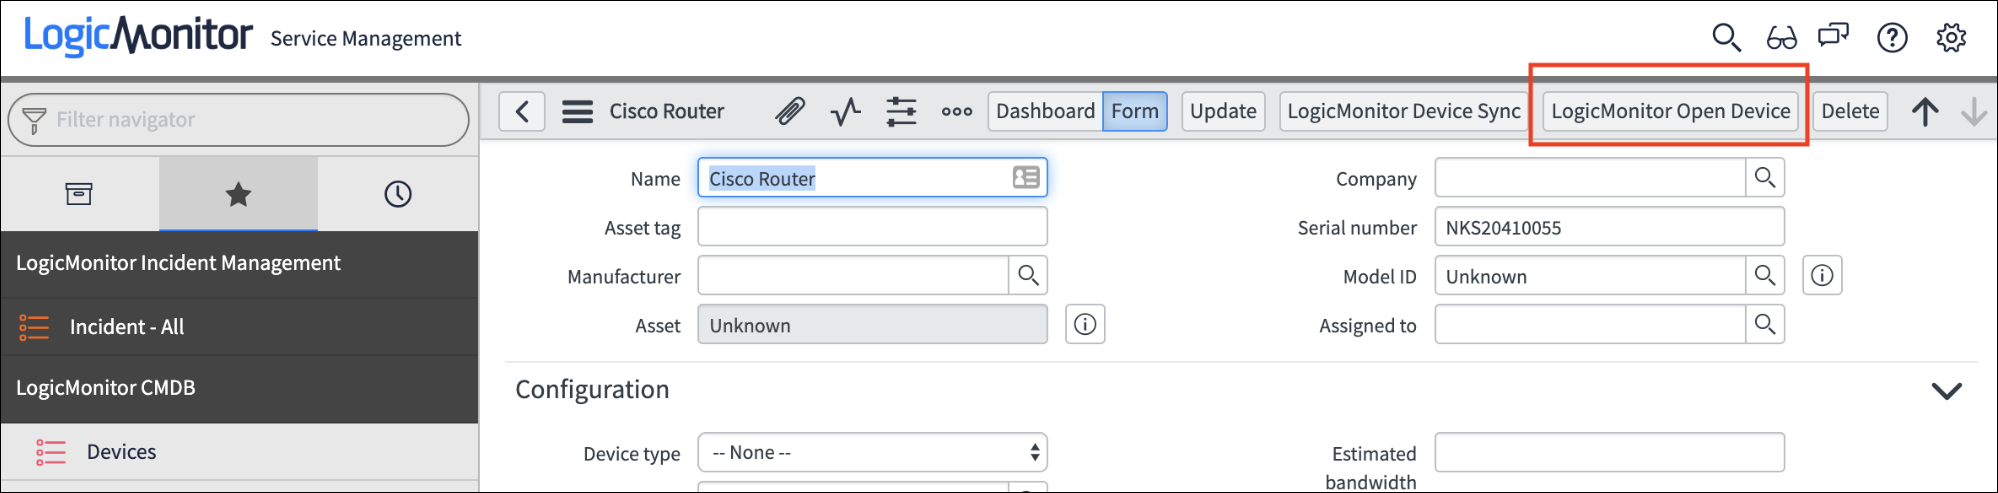
Open a Resource in LogicMonitor from ServiceNow
To make it easier for you to jump between applications, the LogicMonitor ServiceNow CMDB Integration app now allows you to open resources in LogicMonitor directly from ServiceNow. This is a nice complement to the existing ability to launch ServiceNow CIs from within LogicMonitor.
Learn More
The LogicMonitor ServiceNow CMDB Integration is a premium, add-on feature available from the ServiceNow Store. To learn more about it, check out these resources:
- Video: Introducing the LogicMonitor Service CMDB Integration
- Setup guide: Getting Started with the LogicMonitor Service CMDB Integration
Other v.125 Enhancements
Alerting
- Notifications delivered despite alert SDT. In some cases, alert notifications continued to escalate after the alert was placed into SDT. This has been resolved.
- Clear notifications sent upon alert acknowledgment. In some cases, alert cleared notifications were sent upon the acknowledgment of alerts. This has been resolved.
LM Cloud
- Improved error message. Selecting an Auto-Balanced Collector Group for local Collector monitoring for AWS EC2 instances, Azure VMs, or GCP Compute Engine instances resulted in an incorrect error message in certain cases. This has been corrected.
- Amazon Web Services (AWS) monitoring updates:
- AWS FSx. Added monitoring support for Amazon FSx. Specifically, LogicMonitor can now discover Windows and Lustre file server systems and pull in CloudWatch metrics for these systems.
- AWS ECS tags. AWS ECS tags are now saved as properties.
- ENI discovery. A new AutoProperty, system.aws.networkInterfaceIds, has been added to discover Elastic Network Interfaces (ENIs) for EC2 instances.
- Microsoft Azure monitoring updates:
- Azure MariaDB. Added discovery and monitoring for Azure MariaDB instances.
REST API
- Get data for instances across devices in a single request. A new endpoint, POST /device/instances/datafetch, has been published. This endpoint makes it possible to get data for instances across devices in a single request, where instanceIds get sent in the payload. Start, end, period, and aggregate query parameters available in other data endpoints can be used with this new endpoint.
This new endpoint will enable much greater efficiency when requesting data from the past 24 hours across multiple devices. Note that there are some limitations: (1) you will still need to know instance IDs; (2) only data from the past 24 hours is available; (3) requests will be initially limited to 100 instances per request; (4) there is a lower rate limit for this endpoint.
v.125 LogicModule Releases
LogicModules added or updated since the last release.
New Monitoring Coverage
- Topology mapping addERI_(F5 | PaloAlto) – 2 PropertySources
- New topology mapping functionality adds cluster and HA relationships
- Topology mapping New TopologySources (Cisco Wireless | F5_L2_HA | Networking_L2_snmpSwitch | PaloAlto_L2_HA) – 4 TopologySources
- Import new TopologySources for new topology mapping functionality
- Topology mapping Cisco Wireless Access Points – 1 DataSource, 1 TopologySource
- New topology mapping functionality adds L2 support for Cisco WLC linked access points
- AWS FSx (Lustre | Windows File Server) – 2 DataSources
- Discovers Windows and Lustre file server systems and pulls in CloudWatch metrics for these systems
- Cisco Viptela (SD-WAN) – 1 ConfigSource
- EMC Unity – 39 DataSources, 2 PropertySources
- Comprehensive monitoring for EMC Unity Hybrid and All Flash storage arrays (300, 400, 500 and 600 series). See EMC Unity Monitoring for details on this new monitoring package.
- GCP Data Analytics BigQuery – 1 DataSource
- Pulls in BigQuery statistics for account-level devices
- Microsoft Azure MariaDB – 1 DataSource
- Azure Monitor metrics monitoring for Azure MariaDB servers
- Microsoft Exchange 2016 and 2019 – 22 DataSources, 2 PropertySources
- The Microsoft Exchange monitoring suite has been extensively restructured to improve version compatibility and performance across versions 2016 and 2019. See Microsoft Exchange Monitoring for migration details.
- NetApp (Cluster Status | 7mode Status) – 2 DataSources
- These two new NetApp DataSources replace the legacy SNMP based version (NetAppStatus) in favor of ONTAP
- Nutanix Product Info – 1 PropertySource
- Fetches cluster name and version and assigns them as properties
- PureStorage – 1 SNMP SysOID map
- Viptela BFD Summary – 1 DataSource
Monitoring Improvements
- Topology mapping addERI_* – 12 PropertySources
- For improved topology mapping functionality, update/import all PropertySources prefixed with “addERI_” (e.g. addERI_Cisco, addERI_Vcenter, add_ERIDevice, etc.).
- Topology mapping Updated TopologySources (snmpSwitch_Cisco | snmpSwitch_RFC1213 | VMware_vCenter_Topology) – 3 TopologySources
- Updates to support new topology mapping functionality
- Topology mapping VMware vCenter (ClusterPerformance | DatastoreCapacity | DatastorePerformance | DatastoreStatus | HostInterfaces | HostPerformance | HostStatus | HostVSwitch | VMDK | VMInterface | VMPerformance | VMStatus) – 12 DataSources
- Updates to support new topology mapping functionality
- addCategory_Linux_SSH – 1 PropertySource
- Fixed issue with exception handling
- EMC VMAX Core – 2 DataSources
- Fixed graph max value for proper scaling
- F5 – 14 DataSources (All F5 DataSources except F5 GTM)
- Made various improvements to DataSource display names, grouping, graphs, datapoint descriptions, and alerting
- HP Chassis and HP System – All 11 DataSources
- Made AppliesTo changes to only apply towards system.sysinfo =~ “Integrated Lights-Out” as previous versions were also applying towards hasCategory(“snmp”) && Servers() which resulted in unnecessary Active Discovery events scheduled; minor script cleanup
- Linux SSH Network Interfaces – 1 DataSource
- Added regex format support for older RHEL hosts; minor script and graph improvements
- LogicMonitor Portal Metrics – 1 DataSource
- Improved null exception and no data handling to ensure successful script execution
- PureStorage Performance (SNMP) – 1 DataSource
- Fixes to AppliesTo script; graph and datapoint updates
- Veeam Backup & Replication – All 8 DataSources
- Fixed typo in auto property settings
- VMware vCenter (AdmissionControl | ClusterPerformance) – 2 DataSources
- Added support for multi-data-center cluster instance deduplication
- WinExchange (Processes | Services) – 2 DataSources
- Minor improvements to datapoints, graphs and alerts. These DataSources should be updated in parallel with importing the new Microsoft Exchange DataSources (highlighted in the previous section). For more information, see Microsoft Exchange Monitoring.
