v.97 Release: NetScan Overhaul, Expanded Cloud Monitoring, and more
Last updated on 14 September, 2022The LogicMonitor team is winding down 2017 with some major improvements across our platform. The key highlights of the v.97 release include an overhauled NetScan, expanded cloud monitoring, and dashboard importing/exporting.
We only have one more release left in 2017…stay tuned for more exciting updates! v.97 will be rolled out through mid-November.
Overhauled NetScan

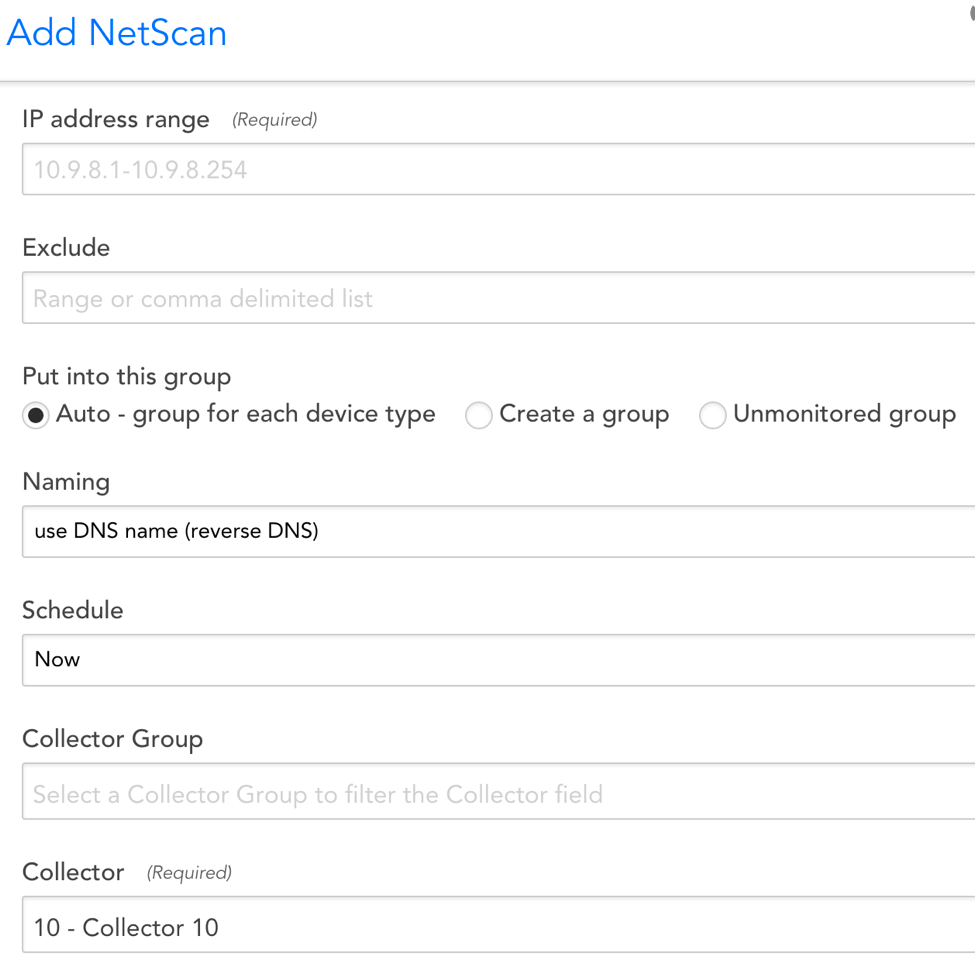
No, we didn’t just capitalize the “s” in NetScan. We also made NetScans easier to use by improving several key aspects, including:
- ‘Basic NetScan’ with a simplified configuration
- Progress bar and list that displays devices as they are being discovered
- Display open TCP ports and detect the manufacturer to help determine device type
- “Auto Group” function which creates dynamic groups for each discovered device type (Windows, Linux, Network, etc)
- Faster NetScan execution. Scan 254 IP addresses in ~1 minute and add 100 devices to monitoring in ~10 minutes
- Reverse DNS is now the default naming method instead of ‘IPADDRESS’
Full details about our new NetScan can be found here. Watch a demo of NetScan here.
You’re not imagining things: we really are churning out more and more Cloud monitoring resources with each release. This time around, we have added support for:
- Azure Storage
- AWS Direct Connect
- AWS NAT Gateway
Importing/Exporting Dashboards
Dashboards can now be exported as a JSON file via the ‘Export’ option in the dropdown menu, and imported into a new account by selecting Add | From File. This is useful for sharing dashboards across accounts.
Note that this works best if dashboards are configured using tokens (to create a template) prior to exporting. This way, the end user can simply replace token values to populate the dashboard with their own data.
Other Improvements
Dashboards
- We now allow dashboards with different parent groups to have the same display name. This further supports the new Dashboard Group cloning functionality we released in v96.
- The SLA widget will now allow the option to ‘exclude SDT periods’ from SLA calculations for Services, as we already do for Devices.
- Improved widget error messages to better indicate configuration issues and help with troubleshooting. i.e. “device not found” is a different issue than “instance not found”
- Now that we support same named dashboards in different dashboard groups, we will display the full dashboard path when cloning/modifying widgets.
- Removed ‘Favorite’ from the Dashboard dropdown menu. Dashboards can still be added to Favorites via the Dashboard Tree.
Devices (Cloud)
- Improved Poll Now information and styling for errors returned during LogicMonitor maintained cloud data collection.
- Improved Azure permission test to account for permissions set at the resource group level.
- You can now manually add, edit and remove system.categories values to cloud devices, just as can be done with traditional monitored devices.
- Added ability to drag n drop AWS and Azure resources in the device tree (e.g. to other device groups). You may find this useful for quickly re-grouping cloud resources outside of the default group structure.
Integrations
- AutoTask Integration will no longer overwrite existing ticket details when updating ticket details.
LogicModules
- LM Config can now execute Config Checks using a Groovy script for more advanced checking.
- In LM Config, if you set some lines to ‘ignore’ they will not show in change history.
- While creating graphs for DataSources, we will now provide a prompt if you try to add a graph line without specifying a datapoint.
NetScan (minor improvements):
- The “@default group” will now be hidden if it is the only established group.
Reports
- The Dashboard Report now shows the full path to each dashboard in the selection drop down.
REST API
- You can now filter on inheritedProperties when requesting devices via the REST API.
- For example: you may set “location” as a group level property and wish to query all devices in your NY office. This can be done with the following filter criteria: filter=inheritedProperties.name:location,inheritedProperties.value:NY
Service Checks
- Service Checks now track SSL Expiration and alert on various SSL-related errors. This requires Collector version 25.300.
Users and Roles
In v.90, we released a new ‘Manager’ role, which is similar to Admin but restricted from security-sensitive actions such as managing Collectors and LogicModules. We have further refined the role to exclude other potentially sensitive actions:
-
- Manage NetScans
- Manage Integrations
- Manage External Alerts
- Manager User Access
This change only applies to new accounts. Existing accounts will need to remove these permissions manually to meet the current definition.
Bugs Fixed
- ‘Home’ button did not display in Device tree in some situations
- Some properties that normally show in “System” section of the Info tab were displayed in “Custom” section
- When using ‘Test Script’ button in PropertySources, the result will display the case correctly.
- If you clone a LogicModule and your “Applies To’ has comments, your comments will no longer result in an invalid syntax
- In PropertySource screen, fixed a bug where lower edge of script window was overlaying the “Save” button
- The Instance Group Alert Tuning tab incorrectly indicated only partially disabled alerting
- On the Devices tab, a space was added between the display name and the hostname (IP address).
LogicModule Releases
Below is a list of new and improved LogicModules that were implemented since our last release:
New Monitoring Coverage
- AWS WorkSpaces– 1 DataSource
Monitoring Improvements
- EMC Storage Pools– 1 DataSource
-
- Fixed datapoint alert message and thresholds.
- AWS Cost by Service– 1DataSource
-
- Fixed ‘rdsCost’ datapoint JSON path
- VMware vSphere Hardware Sensors– 1 DataSource
- Fixed typo in alert message that broke a token
- Fixed typo in alert message that broke a token