Cloud Monitoring using a Collector for Existing Cloud Resources
Last updated - 22 November, 2024
Adding a Local Collector to your AWS, Azure, or GCP platform provides the most detailed access to important data about your AWS EC2 instances, Azure VMs, and GCP compute engine instances. Installing a Local Collector allows you to collect full OS and application-level metrics within your cloud infrastructure.
LogicMonitor collects health metrics for cloud servers from CloudWatch, Azure Monitor, and Stackdriver APIs, However, installing a Local Collector provides a full and comprehensive view of cloud server health by supplementing this API data with full OS and Application metrics.
Data can be collected for the following services:
- AWS EC2 instances
- GCP Compute Engine
- Azure:
- Virtual Machine
- Virtual Machine ScaleSet VM
- PostgreSQL Database Server
- PostgreSQL Database Flexible Server
- PostgreSQL Database for Hyperscale (Citus)
Enabling local Collector monitoring for a cloud device does not result in double billing. The device is billed as an IaaS device, with both CSP API metrics and Collector metrics included in the same pricing structure. This means you can utilize local monitoring without worrying about additional costs.
Requirements for Enabling Monitoring using a Local Collector
To enable cloud monitoring using a local collector, you must have a Collector installed within your AWS, Azure, or GCP environments. For more information, see Installing Collectors.
Installing a Local Collector
You can install a LogicMonitor Collector within your AWS, Azure, or GCP environment to collect non-AWS, Azure, or GCP API data such as operating systems and application-level metrics.
Follow these steps to install a local Collector:
- Create the necessary compute resources in your cloud environment. Use EC2 instances for AWS, Virtual Machines in Azure, and Compute Engines in GCP.
Note: Azure services that support monitoring with a local collector are as follows: Virtual Machine, Virtual Machine ScaleSet VM, PostgreSQL Database Server, PostgreSQL Database Flexible Server
PostgreSQL Database for Hyperscale (Citus).- See Recommended Cloud Specifications for minimum resource specifications to support a local Collector.
- There must be at least one collector per CSP account, one per region, and one per VPC. Linux collectors can monitor linux devices and windows collectors monitor windows and linux devices.
- The security policy needs to allow ssh and/or SNMP communication.
- Install the local Collector onto the cloud environment you created. For more information, see Installing Collectors.
- Once you install the Collector, proceed to Enabling monitoring using a local Collector.
Once you have installed the LogicMonitor Collector, you can access the LogicMonitor’s LogicModule library for your cloud resources, including DataSources, EventSources, PropertySource, and so on. The specific data for CloudWatch, Azure Monitor, and Stackdriver will continue to be collected through the LogicMonitor Collector.
You can view the data collected by the LogicMonitor Collector alongside the CloudWatch, Azure Monitor, and GCP Stackdriver data.
Enabling Monitoring Using a Local Collector
- Navigate to Resources > select the cloud account you want to monitor using a local collector > select
 Manage.
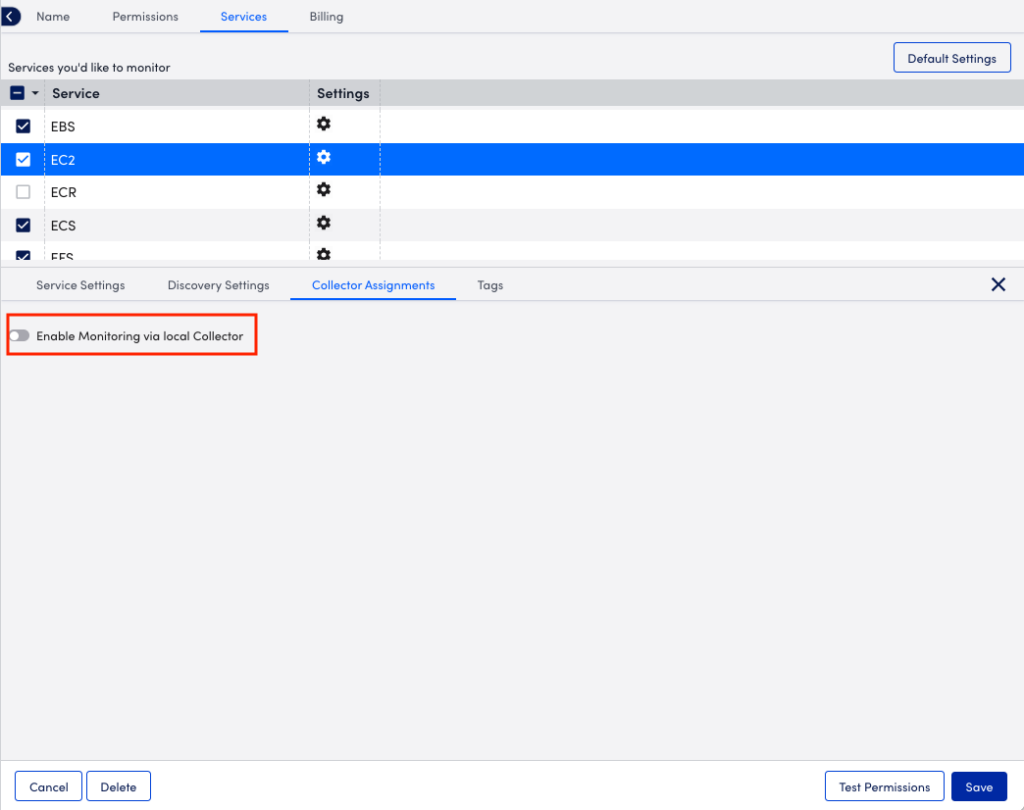
 - Select Services tab, and then select the services you want to monitor with a local collector from the services list. The settings for the service display in a panel.
- Select the Collector Assignments, and toggle the Enable Monitoring via local Collector option to enable the monitoring.
Note: When you disable monitoring through a local Collector, any data previously collected will be deleted. However, CloudWatch, Azure Monitor, and Stackdriver metrics will still be gathered by a LogicMonitor-maintained Collector. To avoid data loss, consider the implications of disabling the local Collector before taking action.

- Select + Add Collector Assignment to add the collector.
- Select + to add the collector and do the following:
- From Collector Group, select a group.
- From Collector, select the Collector you want to use for collecting data.
- From Monitor by, select the method you want to use for monitoring the service.
- In the AppliesTo settings, do one of the following:
- Build the custom query you want to use to apply instances to the Collector by choosing properties from Insert Properties.
You can add a condition to exclude stopped instances from getting a collector assignment to avoid receiving alerts for DataSources like Ping by adding‘&& system.aws.stateName != “stopped”’to an existing query. - Monitor specific regions by selecting In select region, and then choose the regions you want.
- Build the custom query you want to use to apply instances to the Collector by choosing properties from Insert Properties.
Warning: If you choose to deselect a region for monitoring EC2 instances, you have two options for managing existing instances. If configured for deletion, these instances are removed according to the set schedule. If not configured for deletion, monitoring ceases for instances that no longer meet the specified criteria, but local Collector data collection persists as long as it remains enabled.
Note: If you unselect a region for EC2 monitoring, you can either delete instances as scheduled or stop monitoring those that no longer meet the criteria, while local Collector data collection continues if enabled.
- The collector assignments map to the Collectors in the EC2 instances, VMs, or Compute Engine instances they should monitor. You can assign Collectors based on EC2, VM, or Compute Engine properties like AWS region or VPC, Azure subnet, or a custom tag. You may also want to add a condition to exclude stopped instances from getting a collector assignment to avoid receiving alerts for DataSources like Ping – you can add ‘&& system.aws.stateName != “stopped”’ to an existing query.
Note: Currently, you can only use properties starting with system.aws, system.azure, and system.gcp.
Note: For EC2 instances with two IP addresses, LogicMonitor uses the first private IP by default. To monitor a different IP, set the cloud.primaryIP property to your desired IP address.
- (Optional) You can select Discovery Settings and toggle the Use custom NetScan Frequency option to enable more frequent discovery for the EC2 / VM / Compute Engine service. Enabling this option will allow you to configure LogicMonitor to check for new EC2 / VM / Compute Engine instances up to every 10 minutes (more frequent than the default frequency for all services, which has a minimum of 1 hour). This frequency will only apply to the EC2 / VM / Compute Engine service. In addition, you can select Enhanced Detection in Resources, to increase detecting new devices, and status changes of existing devices. For more information, see AWS Monitoring Setup and Adding Microsoft Azure Cloud Monitoring.
- Select Save.
In cases where an EC2 instance matches multiple Collector assignments, only the last assignment will take effect. This prioritization means that careful management of Collector assignments is crucial to ensure the correct data is monitored.
Recommended Cloud Specifications
The amount of data that a Collector can handle depends on the Collector’s configuration and resources. For more information, see Collector Capacity.


